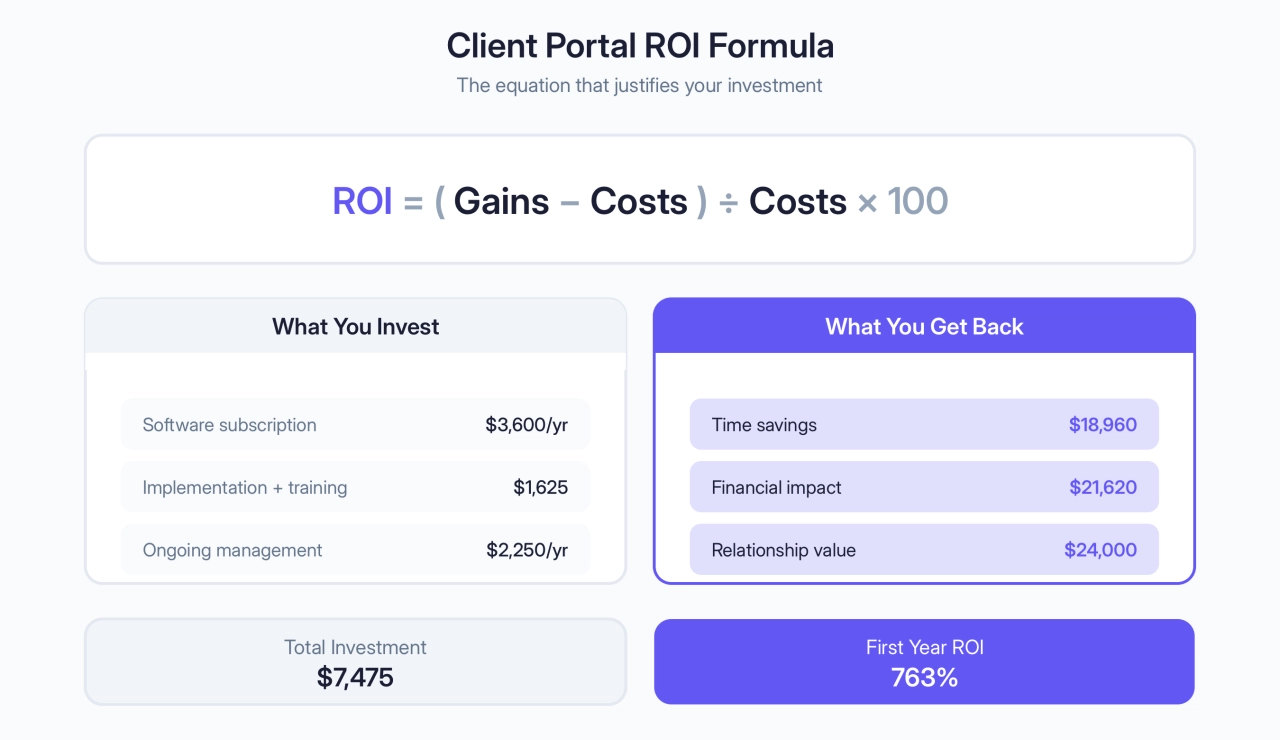
- A typical agency sees 400-750% ROI from their portal—most hit breakeven by month 6.
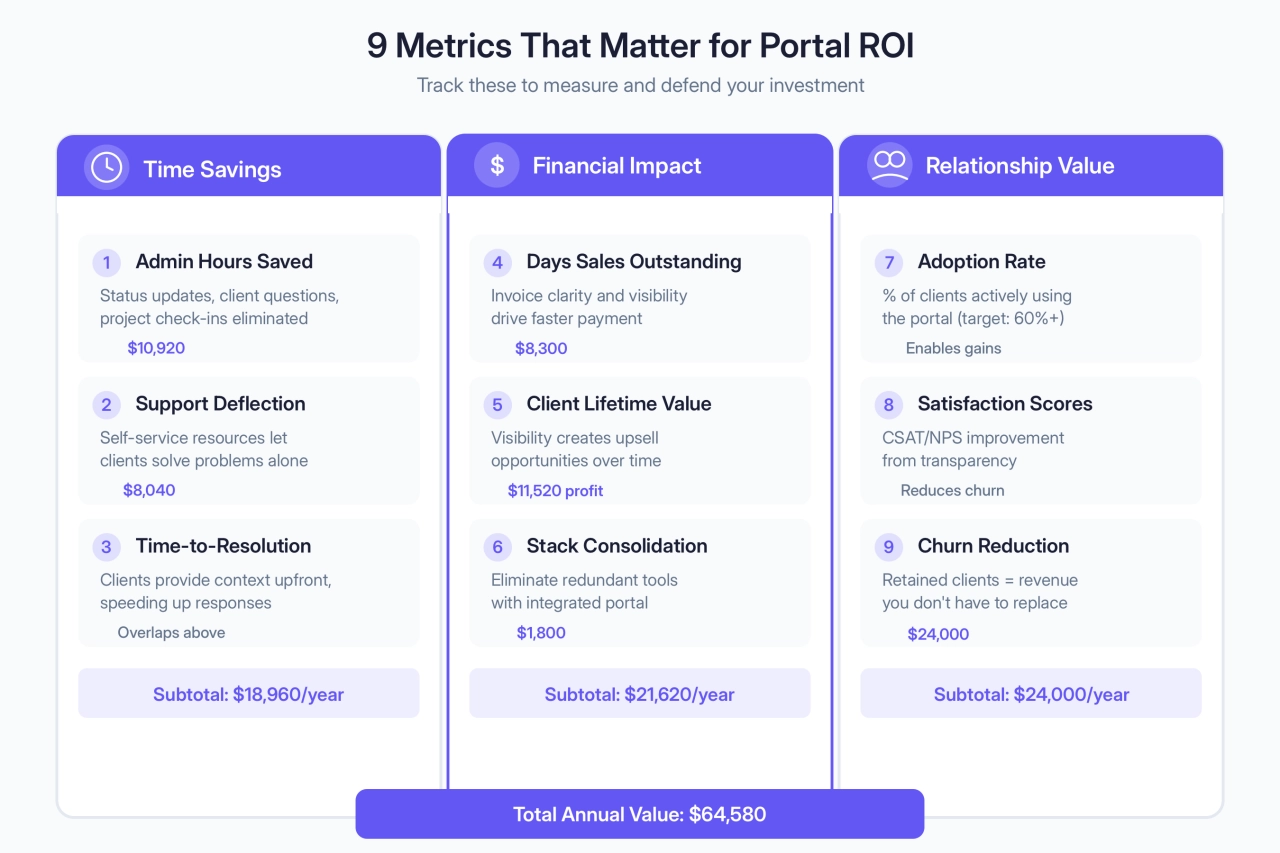
- The gains come from three places: time savings, faster payments, and clients who stick around longer.
- Nine metrics tell you if it's working, and all of them convert to actual dollars.
You’re looking at client portal pricing and thinking: will this actually pay for itself?
Someone’s telling you about “efficiency gains” and “better client experience.” But you need to justify a few hundred dollars a month to your leadership team, your partners, or yourself—and vague benefits don’t cut it.
Here’s the problem. Most portal conversations stop at what the platform does. They don’t tell you what it means for your cash flow, how many hours your team stops burning on status updates, or when you’ll actually break even.
Without the math, you’re guessing. This guide gives you the math.
Whether you’re evaluating your first portal, trying to justify one that’s underperforming, or comparing platforms, the ROI framework is the same. The numbers change; the approach doesn’t.
The problem with “trust me, it’s worth it”
You’ve been in this meeting. Someone proposes a new tool. The ops team sees the potential. Leadership nods along—until someone asks about the ROI of implementing a client portal.
Silence. Then hand-waving about efficiency and client experience.
The benefits of a client portal are real—less time on manual updates, better client visibility, fewer status-check emails. But without numbers attached, those benefits feel like assumptions. And assumptions don’t survive budget conversations.
Worth implementing means if I build this, how much is it going to cost? And are you going to save at least that amount of money with that automation within a year’s time? If you’re not going to save it, you might as well just do the task manually.
 Evripides Gavriel,
ClickUp Consultant
Evripides Gavriel,
ClickUp Consultant
That’s the bar. Let’s clear it.
How to calculate portal return on investment
Here’s the formula:
ROI = (Gain from Portal - Cost of Portal) / Cost of Portal × 100
Anything above 100% means the investment paid for itself. Now let’s break down both sides of that equation.
What this is actually costing you
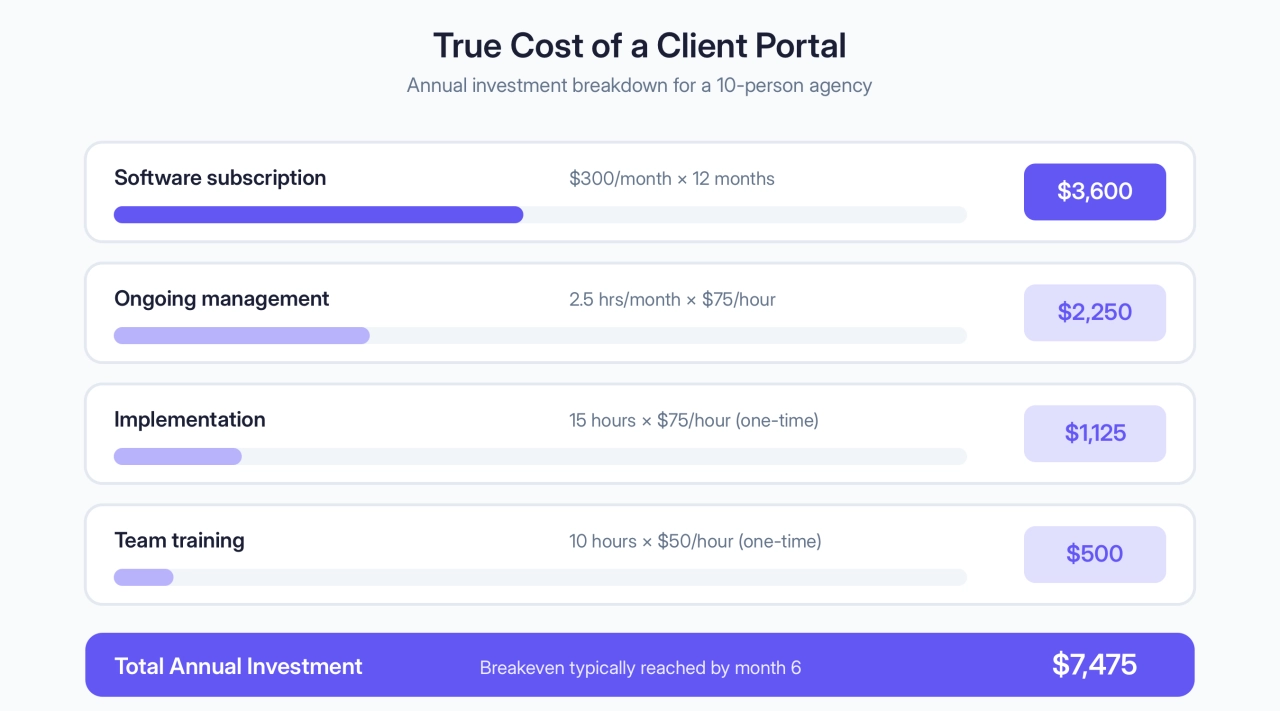
Most agencies only count the subscription ($200–500/month). But the true cost includes implementation time (10–20 hours for setup, branding, and training) and ongoing management (2–3 hours/month for user access and maintenance).
Here’s what that looks like annually for a 10-person agency:
Cost Category | Breakdown | Annual Amount |
|---|---|---|
Software subscription | $300/month × 12 months | $3,600 |
Implementation | 15 hours × $75/hour | $1,125 |
Ongoing management | 2.5 hours/month × $75/hour | $2,250 |
Training | 10 hours × $50/hour (team time) | $500 |
Total Annual Cost | $7,475 |
Notice I’m using hourly rates. This matters because the cost isn’t just what you pay the vendor. It’s also the internal time your team spends setting it up and maintaining it. That has a real monetary value.
One thing the table doesn’t show: those 15 implementation hours aren’t always smooth. Expect a week or two of “why isn’t this syncing” and clients asking where their old links went. The setup cost is real, but it’s also temporary—most agencies are past the friction within the first month.
Not sure what your actual team costs are? Use our team cost calculator to calculate your true team labor cost, including salaries, overhead, and benefits. This gives you the accurate hourly rate to use throughout your ROI calculation.
What it’s actually saving or earning you
Calculating client portal financial gains is where most agencies get vague. “Well, we save time on status updates.” That’s true, but what does that mean in dollars?
You need to convert time savings into money. If your average team member makes $50/hour and they save 3 hours per week answering client questions, that’s $150/week or roughly $7,800 per year in labor costs saved.
We measure the success of automation by its direct impact on revenue, not by hours saved.
 Maxwell Finn,
Unicorn Marketers
Maxwell Finn,
Unicorn Marketers
Gains come from three places—most agencies only think about the first:
Efficiency: Your team spends less time on status updates and client questions.
Financial: Faster payments (better DSO), more upsells from visibility, and fewer redundant tools.
Relationship: Clients stay longer, refer more, and trust you more because they see the work happening.
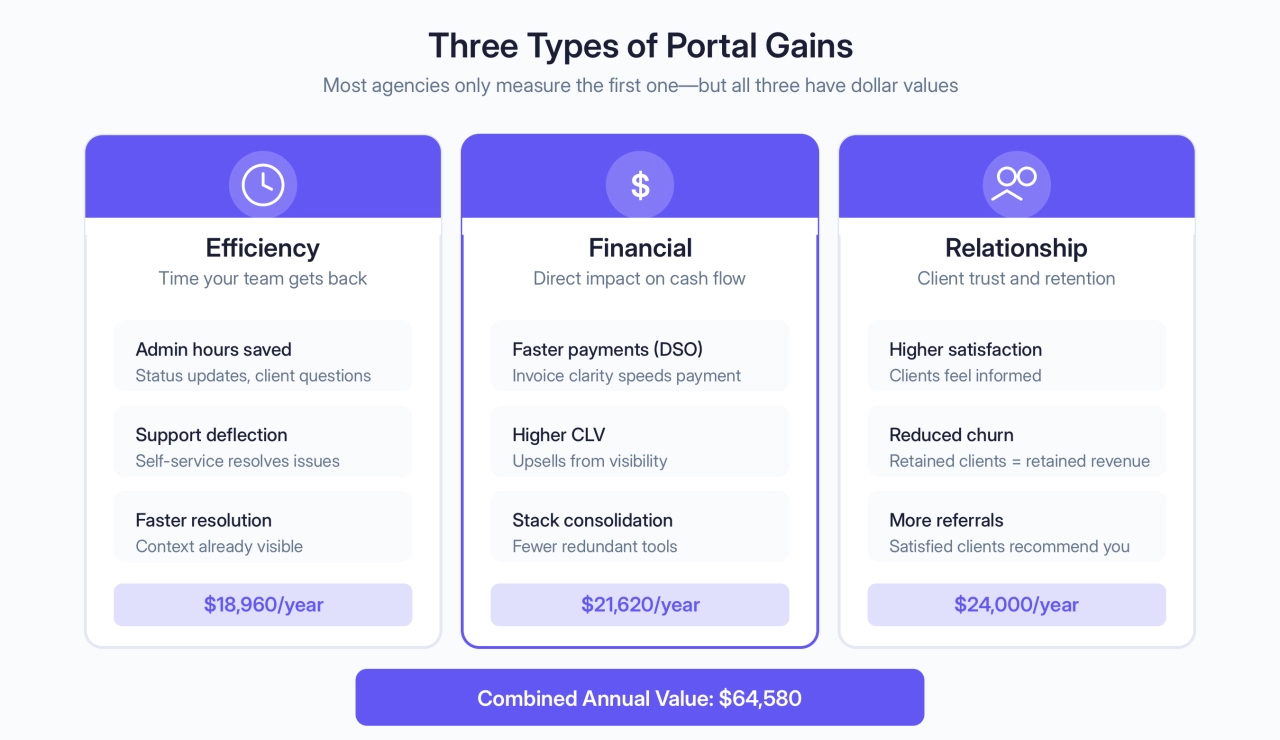
All three matter. All three have dollar values attached to them. And most conversations about portal return on investment ignore the last two completely.
What metrics to track for portal ROI
Nine metrics matter. Here’s how to track each one.
Time savings
These are the hours your team gets back. They’re the easiest to measure and usually the first place you’ll see ROI.
Administrative hours
How many hours does your team spend on “Where’s my project?” and “When’s the next update?” emails? Those are legitimate questions, but a portal answers them automatically.
To measure this, track how much time your team currently spends on administrative tasks related to client communication and status updates. A realistic estimate for a 10-person agency handling client status questions is about 5–8 hours per week total. Even if your portal reduces this by 40%, you’re looking at 2–3 hours per week freed up.
This labor cost reduction from administrative tasks represents 100–150 hours per year. At an average loaded cost of $60/hour for your team, that’s $6,000–9,000 in annual savings.
My ROI is pretty good—from my own calculations, I’m saving somewhere around 8–10 hours of admin time per week through the platform, which comes to a massive productivity boost. Clients always mention how helpful it is to have everything at their fingertips and being able to track or talk through the portal.
 Thomas Franklin,
Swapped
Thomas Franklin,
Swapped
How to track it: Ask your team to estimate weekly time spent on client status questions and updates for the next month before you launch the portal. Then measure again after 3 months of portal adoption. The difference is your savings.
Support ticket deflection
A well-configured portal system with self-service resources (documentation, FAQs, common answers) means your clients solve problems themselves instead of creating a support ticket. This frees up your team for higher-value work. The must-have portal features that drive deflection include knowledge bases, project dashboards, searchable file libraries, and AI assistants.
Let’s say you currently handle 40 client support requests per month across all clients. If your portal deflects 25% of those (a conservative estimate), that’s 10 tickets you never have to spend time on. Each ticket takes roughly an hour to handle from initial contact to resolution. That’s 10 hours per month or 120 hours per year.
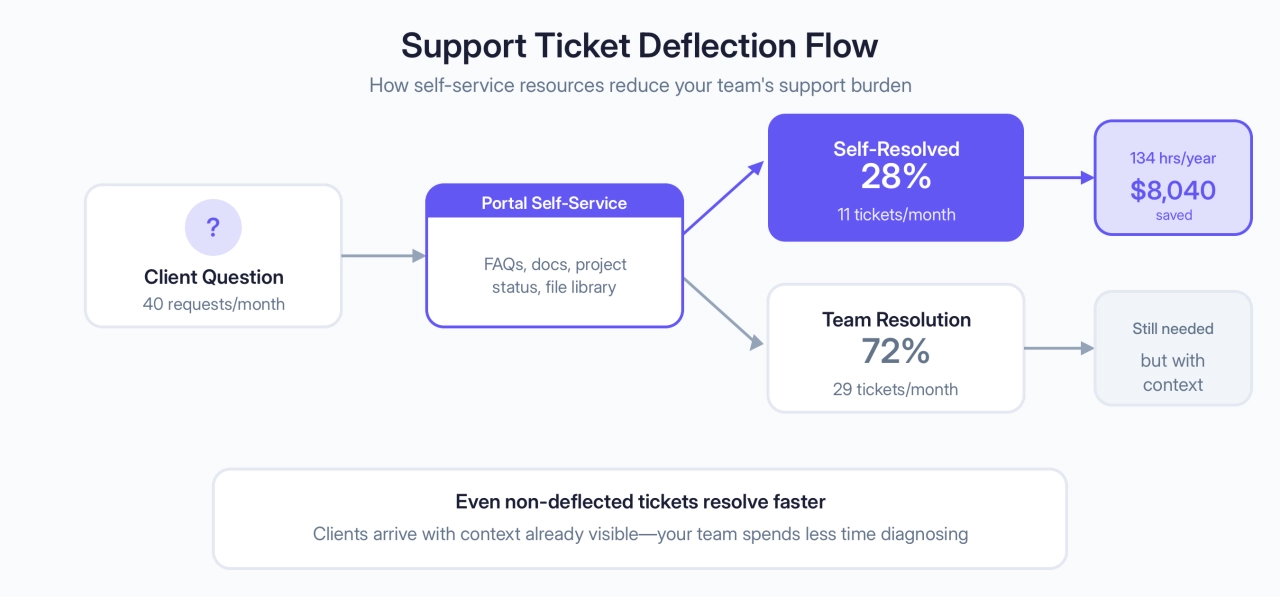
Support ticket deflection represents another $7,000+ in annual value.
If you’re setting up self-service resources for the first time, our complete guide to client portal self-service covers best practices for documentation, FAQ structure, and resource organization that drive adoption and deflection.
How to track it: Set up a tracking system (even a simple spreadsheet is fine) that marks which support requests were “self-resolved” by the client using portal resources versus requiring team intervention. Calculate your deflection rate after 6 months of operation. The formula is: (Self-resolved requests / Total requests) × 100.
Time-to-resolution
Some questions still need your team. But a portal can speed up how long it takes to answer them because the client has already found the context they need.
Instead of a client emailing you a vague question and your team having to dig through project files to understand what they’re asking, the client logs into the portal, sees the project status, and sends you a specific follow-up question. Your team spends half the time figuring out what they’re asking about.
Harder to put an exact dollar figure on, but if resolution time drops 30% and you’re handling 40 tickets/month at 1 hour each, that’s 12 hours/month back. At $60/hour, call it $8,600/year.
How to track it: Measure average time from initial client contact to resolved response. Do this for a full month before launch, then again after 3 months and 6 months. You’re looking for a downward trend. Track this as: (Total resolution time for all tickets / Number of tickets).
Financial impact
These metrics hit your bank account directly: faster cash collection, higher revenue per client, and lower software costs.
Days sales outstanding (DSO)
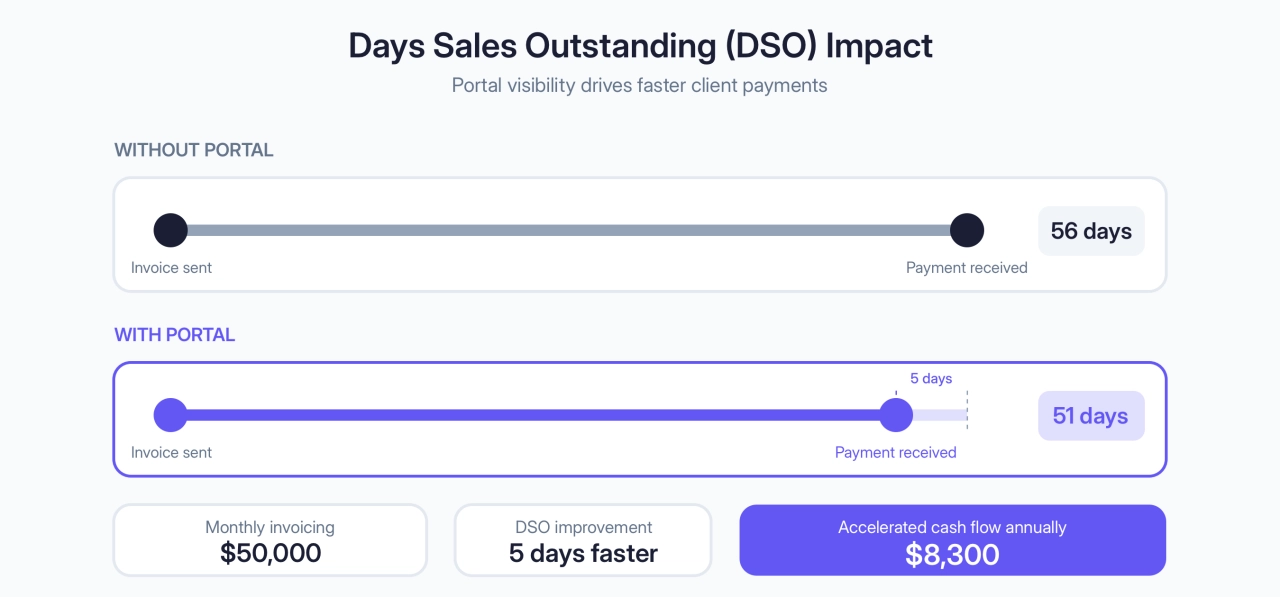
Days sales outstanding (DSO) is the number of days it takes from the moment you send an invoice until the moment money hits your account.
Portal visibility can drive faster payment. Most agencies miss this. If a client can log into the portal, see exactly what they were billed for, and understand the value they received, there’s less friction in the payment process. This won’t fix a client with a 90-day AP policy, but it removes the back-and-forth for clients who would pay faster if they had clarity.
The median DSO across B2B industries is 56 days, though professional services and consulting firms often operate with longer payment cycles. That means you’re waiting 8 weeks to get paid. If a portal solution reduces this by even 5 days, you’re looking at significant working capital improvement.
Let’s say you invoice $50,000 a month. A 5-day reduction in DSO means you’re 5 days closer to cash every month. That doesn’t sound like much until you think about what it means annually. Over the year, you essentially get a free $8,300 in accelerated cash flow.
How to track it: Pull your invoicing data. Calculate DSO before portal launch and after 6 months of operation. Formula: (Average Accounts Receivable / Total Revenue) × Number of Days in Period.
Client lifetime value (CLV)
A client portal platform that shows clients the work you’re doing creates upsell opportunities. Clients see the breadth of your capability, the professionalism of your execution, and the value they’re getting. This leads to more services per client over time.
In our 10-person agency example, let’s say the average client spends $12,000 per year with you. Agencies often report CLV increases of 10–20% over 2 years through expanded services, better retention, and natural upsells. Your results depend on adoption and how actively you use the portal to surface additional services. If we use a conservative 15% increase, that’s an additional $1,800 per client annually. If you have 20 clients, that’s $36,000 in additional annual revenue.
Is all of that profit? No. You’ll have some cost to deliver that extra service. But if your average margin is 40%, you’re looking at an additional $14,400 in annual profit from CLV expansion.
How to track it: Set a baseline. What’s the average annual revenue per client right now? Track this quarterly. After 6–12 months, you should see an upward trend driven by portal adoption. Attribution isn’t perfect, but increased visibility definitely plays a role.
Software stack consolidation
Most agencies use separate tools like Google Drive for file sharing, Asana or Monday for project management, Slack for communication, and various reporting dashboards. That’s 4–5 subscriptions that could potentially be reduced if you have an integrated portal solution.
The best client portal platforms consolidate multiple tools into one. Eliminate 2 subscriptions at $100–150 each and you’re saving $2,400–3,600/year.
How to track it: List out every software subscription your agency currently uses. Identify which ones could be consolidated or eliminated. Calculate the monthly and annual savings. Then, as you implement the portal, track whether you actually eliminate those tools or reduce their usage.
Relationship value
Harder to quantify but often the biggest long-term payoff. Clients who feel informed stick around longer and buy more.
Adoption rate
A client portal software isn’t valuable if nobody uses it. So you need to track adoption.
Client portal adoption rate is simple: what percentage of your clients are actively using the portal? “Actively using” means they’re logging in regularly to check project status, access resources, or retrieve deliverables.
Aim for 60%+ adoption after the first 3 months—but what adoption means depends on your setup. Some portals (like SPP.co) capture email replies and post them into the portal automatically, so clients who never log in are still communicating through the system. In that case, low login rates don’t mean low value. What matters is whether client communication is flowing through one place instead of scattered across inboxes.
Adoption matters because it correlates directly to the value of the investment. Higher adoption rates mean more deflection of support requests, faster payment, and higher client satisfaction. If you’re not sure what features drive adoption, our guide to what makes an effective client portal breaks down the core elements clients expect and how they use them.
How to track it: Pull login data and activity reports from your portal. Divide active users by total client contacts. Track this monthly. You should see adoption climb over the first 6 months as more clients get oriented.
Satisfaction scores
A portal system that shows clients your work and makes them feel informed improves satisfaction. You can track this through CSAT (client satisfaction) or NPS (net promoter score) surveys.
Track whether satisfaction goes up after you launch the portal. Many agencies report satisfaction improvements of 5–10 points on a 100-point scale after 6 months, though your results will vary based on how you implement the portal and communicate changes to clients.
Why does this matter financially? Satisfied agency clients pay their invoices faster. They keep their subscriptions. They refer you. All of that directly impacts your revenue. Part of satisfaction also comes from feeling that their data and work is secure.
How to track it: Send a quick CSAT or NPS survey to clients before you launch the portal (baseline), then again at 3 months and 6 months. Ask a simple question: “Based on your experience with [Agency Name], how satisfied are you with the quality of our work and communication?”
Churn reduction
Client churn reduction is the big one. Annual churn is expensive. If you lose a client, you lose their annual revenue and you have to spend money to replace them with acquisition costs and onboarding time.
Professional services firms see median annual churn of about 27%. A portal won’t magically fix churn because clients leave for lots of reasons. But if better visibility and communication helps you retain even one additional client per year, the math changes fast.
If you have 20 clients generating $240,000 in annual revenue, retaining one extra client means $12,000 in revenue you didn’t have to replace. No acquisition cost, no onboarding time, just revenue that stayed.
More importantly, it means your client base is growing. You’re acquiring new clients at your normal rate, but losing fewer existing ones. That growth compounds year over year.
Want to see what a churn reduction actually means for your long-term revenue trajectory? Use our growth calculator to model different churn rates and see the compounding impact on your MRR over 24–36 months. Even a 2–3% improvement in retention shows dramatic results.
How to track it: Track which clients renew and which ones leave each quarter. Calculate your churn rate. Set a baseline before the portal launch and measure again after 6–12 months.
Quick reference
Metric | Category | Annual Value Range |
|---|---|---|
Admin hours saved | Time | $6,000-9,000 |
Support deflection | Time | $7,000+ |
Time-to-resolution | Time | ~$8,600 |
DSO reduction | Money | $8,300 |
CLV increase | Money | $14,400 (profit) |
Stack consolidation | Money | $2,400-3,600 |
Adoption rate | Relationship | (enables other gains) |
CSAT improvement | Relationship | (reduces churn) |
Churn reduction | Relationship | $12,000+ per client retained |
Client portal ROI example for a 10-person agency
Here’s what the math looks like for a 10-person agency with 20 clients and $240,000 in annual revenue. Your numbers will scale differently—a 5-person agency with fewer high-value clients might see faster ROI; a 20-person agency with 50 clients might see bigger absolute gains. The framework stays the same.
Year 1 costs
Cost Item | Amount |
|---|---|
Portal subscription ($300/mo) | $3,600 |
Implementation (15 hrs × $75/hr) | $1,125 |
Team training (10 hrs × $50/hr) | $500 |
Ongoing management (2.5 hrs/mo × $75/hr) | $2,250 |
Total Year 1 Cost | $7,475 |
Month 6: breakeven
At the 6-month mark, here’s what they’re seeing:
Gain Category | Metric | Calculation | Annual Value |
|---|---|---|---|
Admin time reduction | 3 hrs/week saved | 3 × 52 × $60 | $9,360 |
Support deflection | 25% of 40/mo tickets | 120 hrs/year × $60 | $7,200 |
Faster payment | 5-day DSO reduction | $50K/mo invoiced, 5-day reduction | $8,300 |
Subtotal | $27,860 | ||
Year 1 Cost | $7,475 | ||
Net Gain (6 months) | $20,385 | ||
ROI (annualized) | ~273% |
At 6 months, the investment has already paid for itself 3.6 times over.
Month 12: the payoff
At 12 months, adoption is higher. Client satisfaction is up. Most importantly, churn has dropped. They retained 2 additional clients that would normally have left, each worth $12,000 in annual revenue.
Gain Category | Metric | Calculation | Annual Value |
|---|---|---|---|
Admin time reduction | 3.5 hrs/week saved | 3.5 × 52 × $60 | $10,920 |
Support deflection | 28% of 40/mo tickets | 134 hrs/year × $60 | $8,040 |
Faster payment | 5-day DSO reduction, 5-day reduction | $50K/mo invoiced | $8,300 |
Reduced churn | 2 extra retained clients | 2 × $12,000 | $24,000 |
CLV increase | 12% growth across client base | $240K × 12% × 40% margin | $11,520 |
Stack consolidation | Eliminated 1 redundant tool | $150/mo × 12 | $1,800 |
Subtotal | $64,580 | ||
Year 1 Cost | $7,475 | ||
Net Gain (full year) | $57,105 | ||
Year 1 ROI | ~763% |
By the end of year 1, this agency is looking at 400-750% ROI depending on retention and adoption. Even at the low end, that’s $4 back for every dollar spent. And year 2 gets even better—no implementation costs, just gains.
When will I see portal ROI results?
“How long until this pays for itself?” Here’s a realistic timeline.
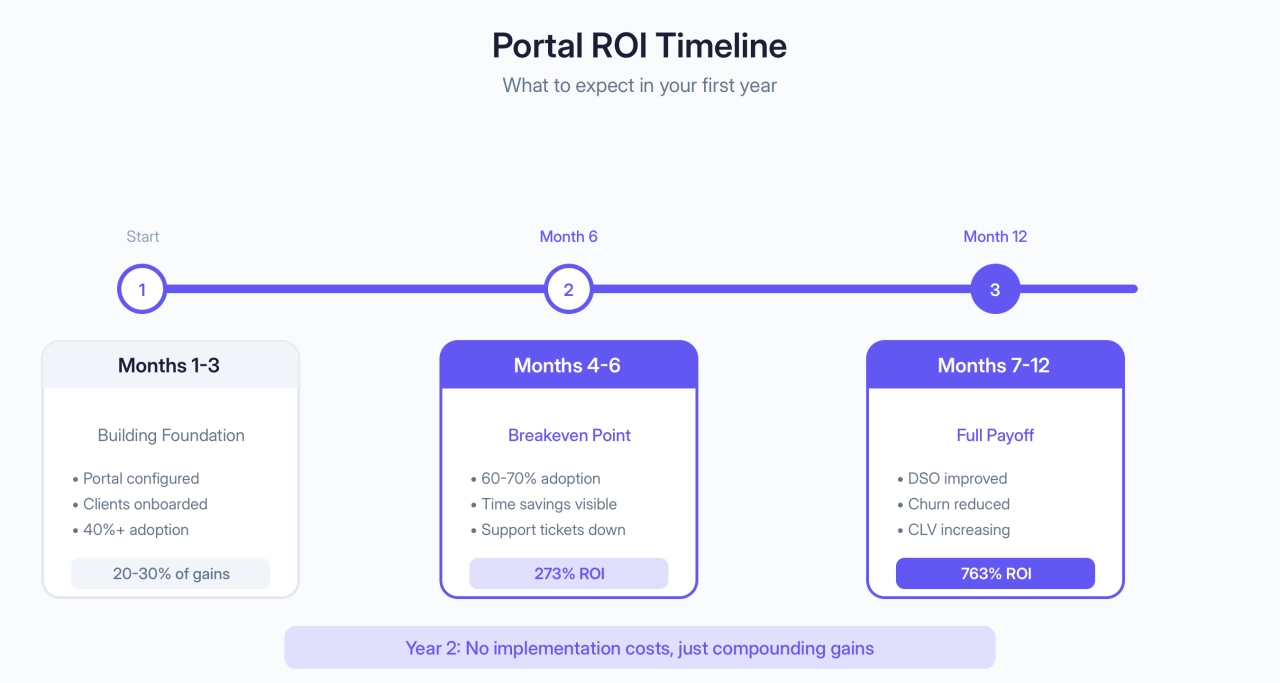
Months 1–3: building the foundation
Portals get configured, clients get invited, adoption climbs. You’re not seeing big gains yet—maybe 20-30% of eventual time savings.
What to track: adoption rate (target 40%+), initial support deflection, and team feedback on workflow changes. The foundation matters even if the numbers don’t pop yet.
Months 4–6: efficiency starts showing up
Now adoption is real. Most of your clients who will adopt have adopted (you’re probably in the 60–70% range). Your team has stopped fighting the system and started seeing the value.
Months 4–6 are when time savings become obvious. Your team is spending noticeably less time on status questions. Support tickets are declining. Your internal process tightens up.
Financially, you should be close to breakeven or already past it. The portal has paid for its cost in time savings alone, even before you see cash flow improvements.
Months 7–12: the money metrics appear
By month 7, the real financial benefits emerge. Your DSO improvement is now in the data. You can see that invoices are being paid faster. Cash flow is better.
Churn data is starting to look different. The clients you thought might leave are sticking around. Revenue per client is up because clients are seeing more of what you do.
By year-end, you have 12 months of data showing 300–700%+ ROI. That’s the business case.
Year 2 is where it gets interesting. No implementation costs, no learning curve. You’re just looking at gains compounding on gains.
How to calculate your agency’s specific portal ROI
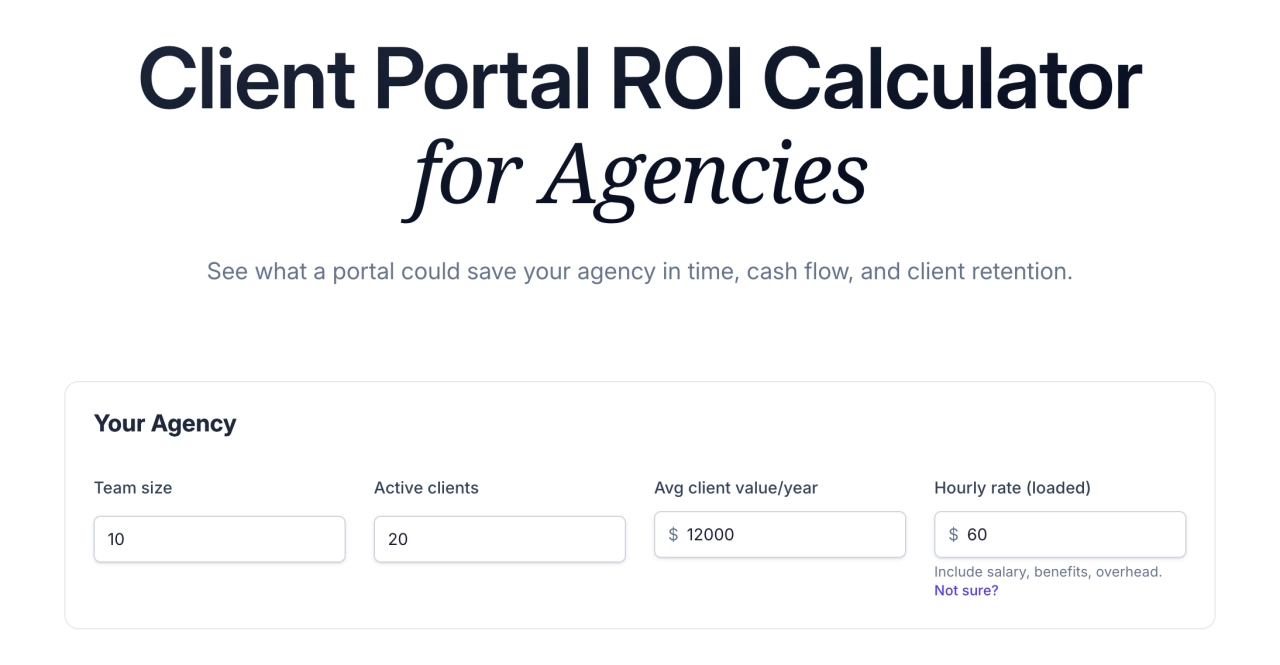
Now plug in your own numbers.
Use our client portal ROI calculator to estimate your time savings, cash flow improvement, and retention upside based on your agency’s size and current workflow. Takes about 2 minutes, and you can share the results with your team.
Calculate your portal implementation ROI
Want to dig deeper? Our team cost calculator gives you accurate hourly rates, and the growth calculator shows how retention improvements compound over time.
Frequently asked questions
How do I measure ROI if I’m just starting the portal implementation?
Establish baseline metrics now: admin time per week, current DSO, churn rate, support tickets per month, and client satisfaction scores. Track the same metrics monthly after launch. The difference between baseline and current state is your ROI.
What’s a realistic adoption rate to expect?
Plan for 40–50% adoption in the first 3 months, climbing to 60–70% by month 6 if your clients love software. Below 40% at month 3 means you need to strengthen your adoption strategy and client training.
How do I get clients to use the portal instead of emailing me directly?
Make the portal easier than email: automatic notifications, prominent onboarding, and redirect email questions to portal resources. Make lower tiers use the portal while keeping premium tiers flexible.
How do I prove ROI to my board or leadership if the metrics are mixed?
Lead with what’s working. If admin time dropped 30% but DSO didn’t budge, lead with the time savings and note that cash flow improvements typically take 6+ months to show up. A 273% ROI from time savings alone still wins the argument.
The part that doesn’t fit in a spreadsheet
You’ve got the math now. The formulas, the metrics, the timeline. You can make the business case.
But here’s what the spreadsheet doesn’t capture: what it feels like when a client logs into your portal and sees the work you’re doing.
Something shifts. They feel more confident in you. They’re less likely to shop competitors. They’re more likely to expand scope. They become a better, stickier client.
That confidence shift doesn’t have a line item. But it’s what turns a software expense into a competitive advantage. It’s why your team stops drowning in status update emails. It’s why your agency starts feeling more professional and more stable.
The ROI you can measure is just the start. The ROI you feel is what makes it stick. Build the spreadsheet. Make the case. Then watch what happens when your clients start trusting what they see.


")