- Discover 10 essential agency KPIs with detailed calculations and real-world examples.
- Master KPI tracking tools and reporting strategies to make data-driven decisions.
- Transform your agency operations with measurable goals that drive results.
If you’re running a marketing agency, you’re probably drowning in data but starving for insights. You know your revenue numbers, but do you know if you’re acquiring clients cost-effectively? You can see your team’s busy, but are they actually productive? You’re generating reports, but are they driving better decisions?
For agency owners struggling to measure what really matters with their analytics tools, here’s the solution: Key Performance Indicators (KPIs).
The tricky part is knowing which KPIs actually matter for agencies and how to implement them effectively. Read on to find out how to transform your agency operations with measurable goals that drive real results.
Understanding this topic involves several interconnected concepts:
Each of these concepts plays a crucial role in the overall topic.
What KPIs mean
KPIs is the shortened plural of Key Performance Indicator (KPI). The acronym refers to values that a company defines in a given time-frame to achieve a certain goal, and measure performance. KPIs can be set for pretty much anything, from response times in tickets to revenue growth.
For marketing agencies specifically, KPIs become crucial for determining profitability and assessing the effectiveness of your efforts. These metrics help track progress, pinpoint areas for improvement, and guide data-driven decisions on where to concentrate your resources.
With that said, KPIs shouldn’t be confused with OKRs, which stands for Objectives and Key Results. OKRs are a method to set goals in order to improve performance. And KPIs are needed in order to set OKRs.
Why KPIs matter for marketing agencies
Before selecting KPIs, let’s look at their advantages and limitations specifically for agency operations.
Advantages for agencies
Key Performance Indicators (KPIs) offer numerous benefits for marketing agencies, driving both operational efficiency and strategic success.
Client-focused motivation: KPIs provide clear targets that motivate your team by giving them tangible goals. Case in point is an agency team hitting their 90% utilization rate target, which directly impacts profitability.
Real-time decision-making: By tracking KPIs in real-time, agencies can make swift adjustments to strategies. You can quickly see if your customer acquisition cost is climbing and adjust your marketing spend accordingly.
Performance measurement: KPIs offer a straightforward way to measure and compare performance over time, helping identify trends and highlight areas needing improvement.
Limitations to consider
While KPIs are powerful tools, they come with limitations that agencies should be aware of:
Overemphasis on numbers: Focusing solely on metrics can lead to a narrow view of success. For instance, hitting revenue targets while ignoring client satisfaction scores can lead to future churn.
Potential for manipulation: There’s a risk that KPIs can be manipulated to present a favorable picture rather than reflecting true performance. This happens when teams game the system to hit targets.
Unintended consequences: KPIs can sometimes create perverse incentives. An agency focused only on billable hours might sacrifice quality work or team development time.
The key is using KPIs as part of a broader performance management strategy, balancing quantitative metrics with qualitative insights.
How to create effective KPIs
Good KPIs are realistic, easy to measure, and directly related to your agency’s business activities. Let’s look at the SMART method specifically applied to agency operations:
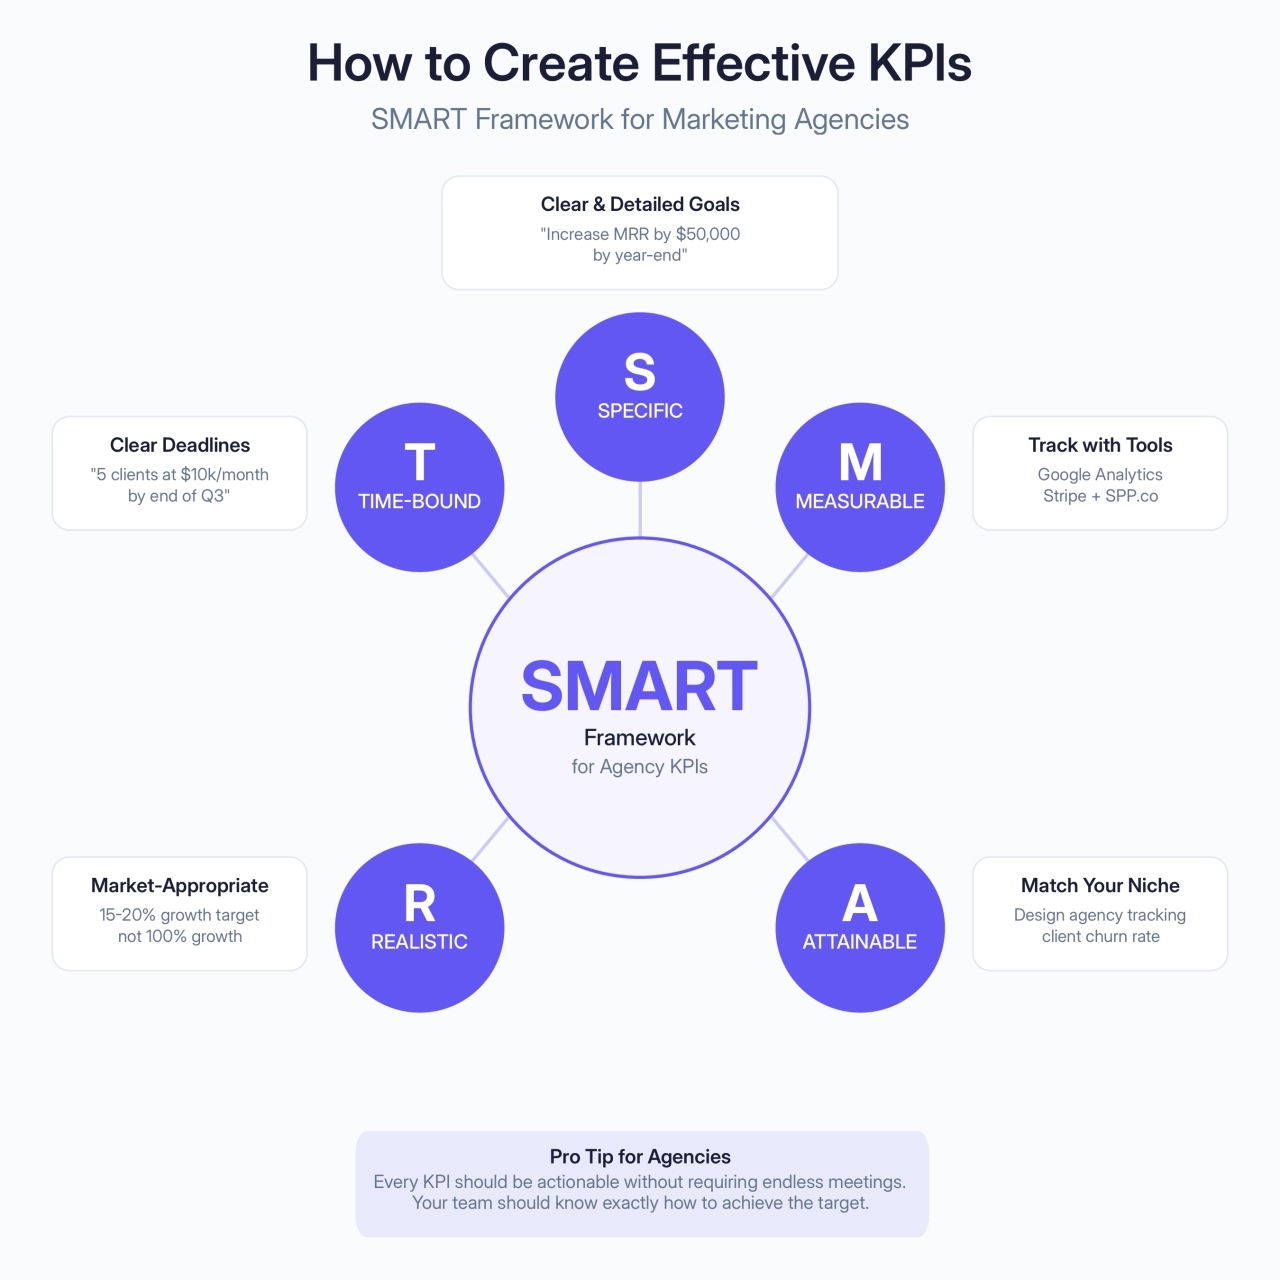
With these principles in mind, make sure all your KPIs are actionable without requiring endless meetings. If your KPI is to get 15 new leads per month, your team should know exactly how to achieve that through specific marketing channels and tactics.
How agencies track KPIs
Before we dive into specific KPIs, let’s talk about the practical side of tracking them. In order to improve your agency’s profitability, you need to look at different data points to make adjustments to your operations.
Here are two essential strategies for tracking KPIs that will make your life as an agency owner much easier down the road.
Use KPI tracking software & tools
There are several software options available to track and analyze your agency’s KPIs effectively:
Google Analytics for measuring your acquisition efforts and agency client reporting
Stripe for processing payments and tracking revenue numbers
Google Tag Manager for tracking conversions
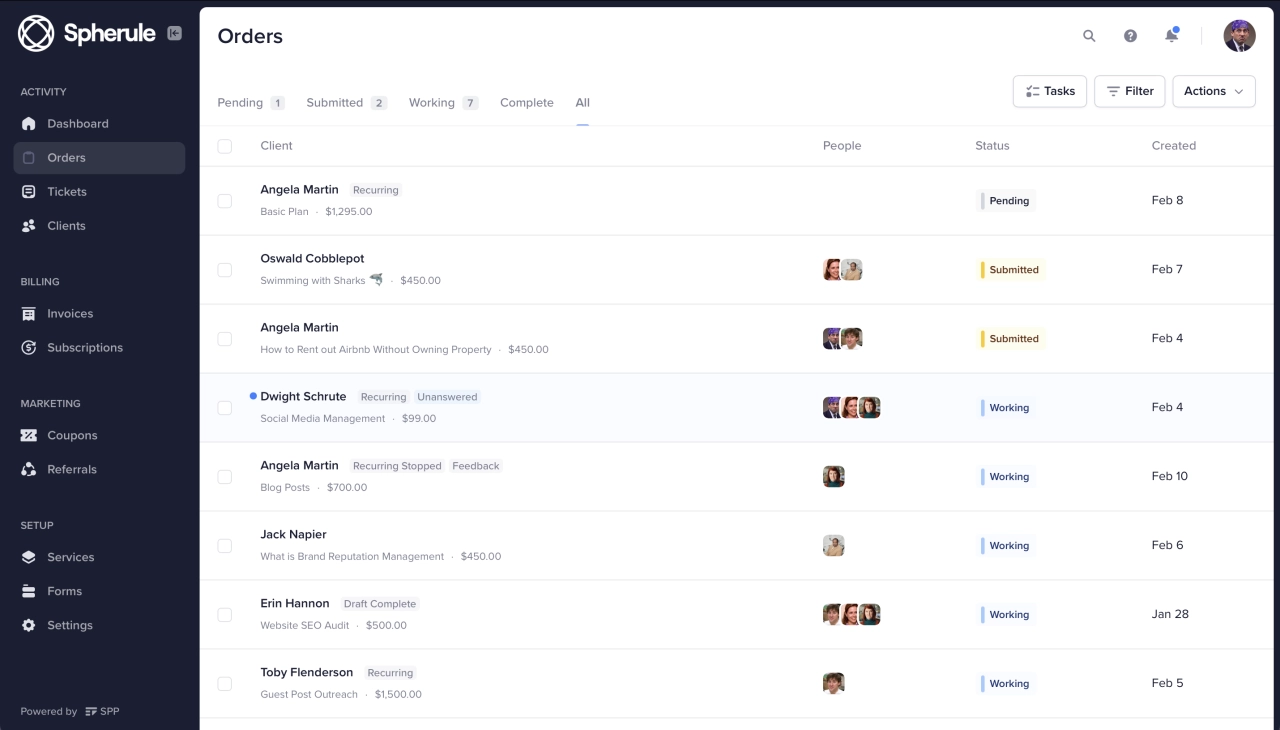
SPP’s client portal integrates with all three of these tools. Simply activate the integrations and send all data you collect in your customer portal. Then, build reports in Looker Studio to help you visualize your agency’s performance.
Start tracking productivity
If you’re not tracking your team’s productivity, now is the time to start. Productivity tracking can help you see how your team is spending their time, identify areas of inefficiency, and make better use of your team’s time. Plus, there are a ton of valuable KPIs that require accurate productivity data—but more on those later!
SPP can help thanks to built-in project management features that allow you to keep tabs on assigned orders and response times.
Essential KPIs for marketing agencies
Now that you understand how to track KPIs, let’s examine the specific metrics that matter most for agency success. I’ve organized these into three categories based on what they measure.
Financial performance KPIs
These KPIs help you understand the financial health and efficiency of your client acquisition and retention efforts.
Customer Acquisition Cost (CAC)
Customer acquisition cost (CAC) is the amount of money that your agency spends to acquire new customers.
To calculate CAC, simply divide your total sales and marketing spend (including salaries, marketing campaigns, etc.) by the number of customers newly acquired in a given period.
CAC is important because it tells you how efficiently your agency is acquiring new customers. If your CAC is too high, it means you’re spending too much money to acquire new customers, and you need to find a way to lower your costs.
Example: Your agency spent $15,000 on marketing and sales last month, and acquired 4 new clients. CAC is $15,000 ÷ 4 = $3,750.
Client Lifetime Value (LTV)
Customer lifetime value (LTV) is the total value that a customer will bring to your agency over the course of their relationship with you.
To calculate LTV, simply multiply the average revenue per project by the average number of projects that a customer will work with your agency.
LTV is important as it tells you how much revenue you can expect to generate from a single customer. It’s also helpful for determining whether your CAC is too high, because it gives you an anchor for comparing the two numbers.
Example: The average client works with your agency on 5 projects with an average order value of $5,000. LTV is $5,000 × 5 = $25,000.
LTV/CAC Ratio
The LTV/CAC ratio is a simple but powerful metric that tells you how much revenue your agency can generate for every dollar spent on acquiring new customers.
To calculate the LTV/CAC ratio, simply divide your customer’s lifetime value by your customer acquisition cost.
As a general rule of thumb, an LTV/CAC ratio greater than 3 is considered good. This means that for every $1 spent on acquisition, your agency eventually makes at least $3 in revenue. If your LTV/CAC ratio is less than 3, it’s a sign that some area of your operations isn’t optimized:
• Marketing: Are you spending too much on low-value channels?
• Pricing: Are your fees too low?
• Sales: Are you not closing enough deals?
Example: Using your agency’s LTV and CAC from the previous examples. LTV/CAC ratio is $25,000 ÷ $3,750 = 6.67.
Customer Concentration
Customer concentration is a KPI metric that’s often ignored by agency owners. They only look at their total revenue, but not how it’s generated.
Example: Assuming your top 5 customers generate $24,000 in revenue. Customer Concentration = $24,000 ÷ $70,000 × 100 = 34%.
As per the example above, the top five customers generate 34% of your total revenue. Losing those would significantly impact your business. You can also calculate the customer concentration rate for each top customer individually.
Operational efficiency KPIs
These metrics help you understand how efficiently your agency converts time and resources into revenue.
Revenue earning efficiency
Revenue earning efficiency describes how efficiently your agency is converting its time and resources into revenue.
As an agency, all of your revenue is a liability until you’ve actually earned it. It costs you to pay staff, buy tool and software credits, keep the lights on, and so forth.
How efficiently you earn revenue is just as important as the actual revenue your agency is earning. Hitting revenue targets is great, but if you’re only hitting those targets by working overtime, your agency won’t scale.
There are two KPIs you can use to keep tabs on your agency’s revenue earning efficiency:
Metric | What It Measures | Calculation | Example | Benchmark/Notes |
|---|---|---|---|---|
Average Billable Rate (ABR) | Your agency’s average hourly rate | Total Revenue ÷ Billable Hours | $200,000 ÷ 2,000 hours = $100/hour | Doesn’t include non-billable time (admin, sales, business development) |
Gross Margin (GM) | Percentage of revenue that’s profit per project/client | (AGI - COGS) ÷ AGI × 100% | ($90,000 - $67,500) ÷ $90,000 × 100% = 25% | Benchmark for profitable agencies: 20-30% |
We typically aim for a gross margin of around 25%. It accounts for everything we need to deliver high-quality service, people, tools, systems, software, and even the time it takes to manage relationships.
 Mike Rowan,
CEO of KPITarget
Mike Rowan,
CEO of KPITarget
Utilization rate
Your agency’s utilization rate tells you how much of your team’s capacity generates revenue. However, industry experts disagree on optimal targets.
According to our own research for our capacity calculator, many agencies target 80-90% utilization rates. However, Marcel Petitpas from Parakeeto argues that “50-60% utilization is more realistic for sustainable growth”, emphasizing the importance of non-billable time for business development and team development.
The reality depends on your agency model:
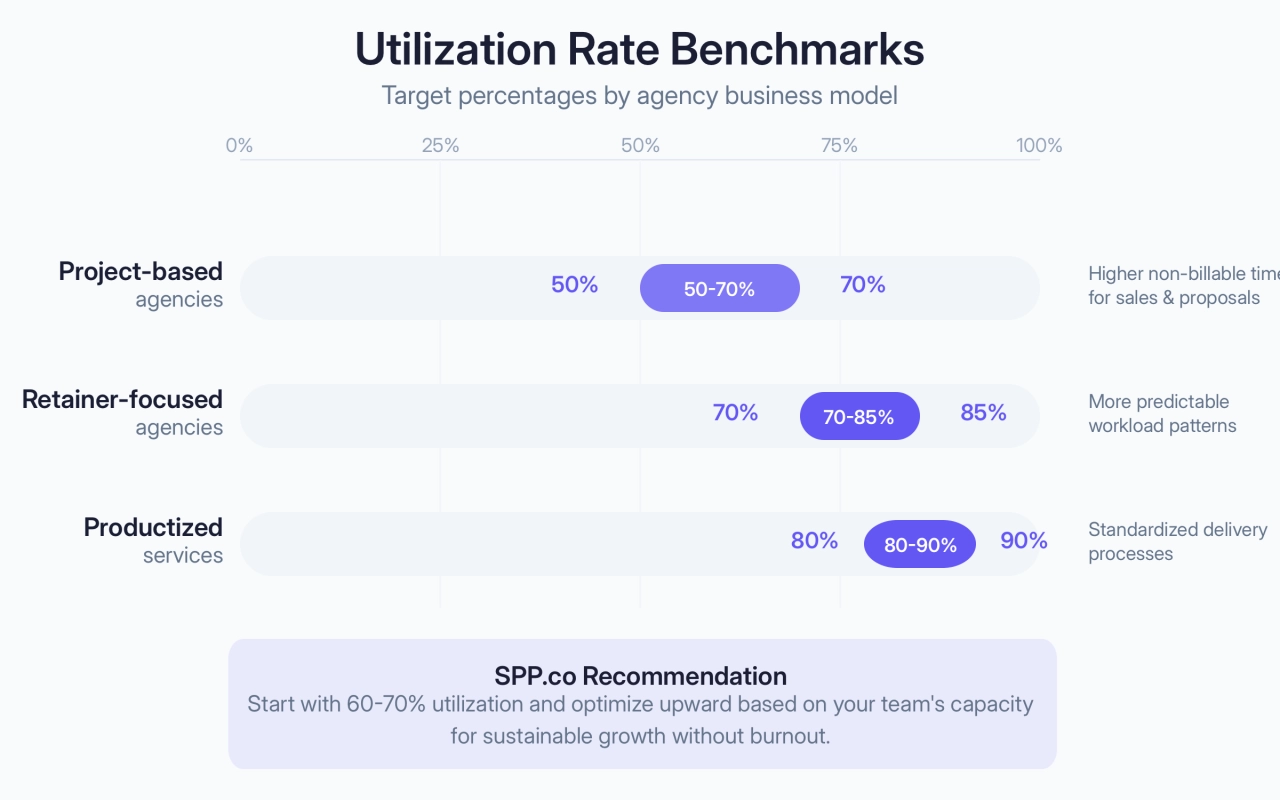
Our recommendation: Start with 60-70% and optimize upward based on your team’s capacity for sustainable growth.
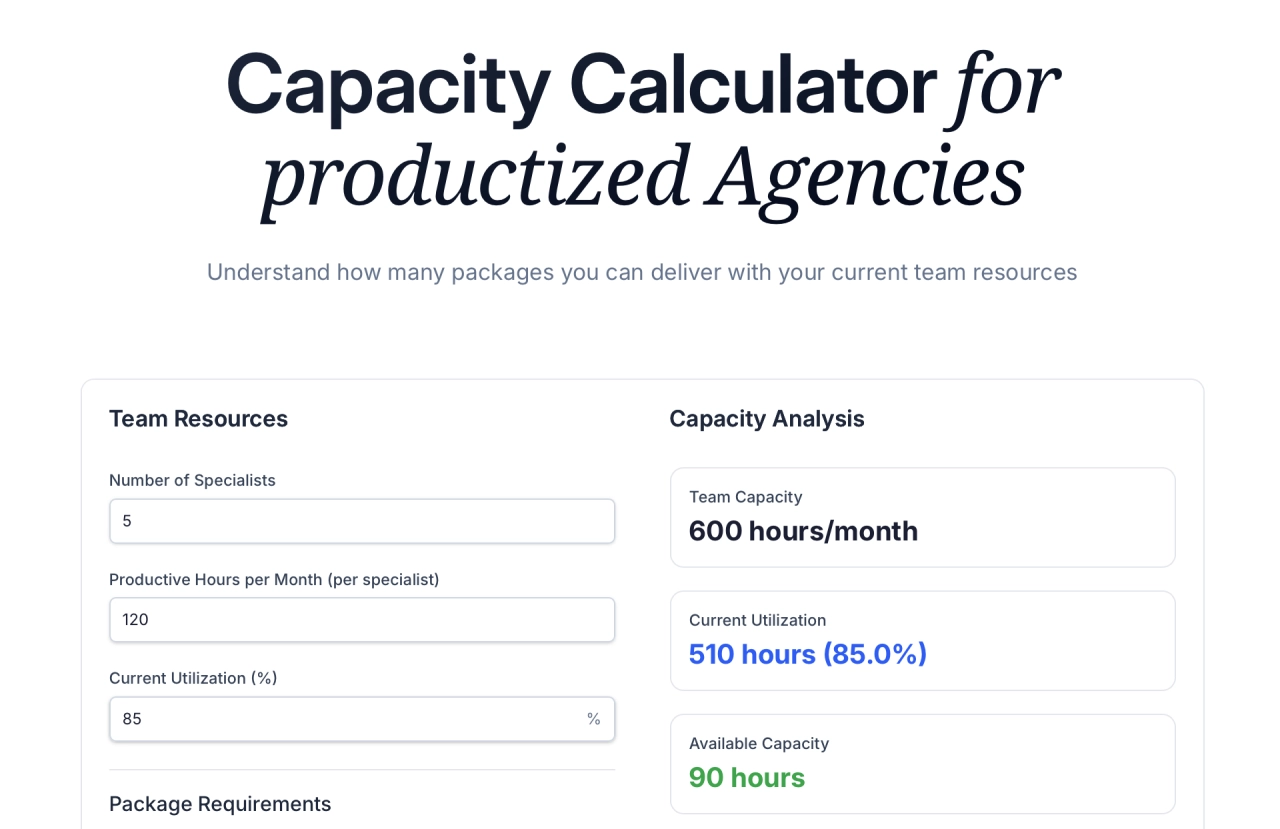
Understand how many packages you can deliver
Revenue per employee (RPE)
Revenue per employee (RPE) is a KPI that tells you how much revenue each member of your team is bringing in. This metric is important for larger agencies in the process of scaling because it can help you identify inefficiencies and areas for improvement.
A high RPE is indicative of a well-oiled machine. A low RPE could mean you’re overstaffed or that your team isn’t as productive as it could be.
The benchmark depends on your agency’s gross revenue:
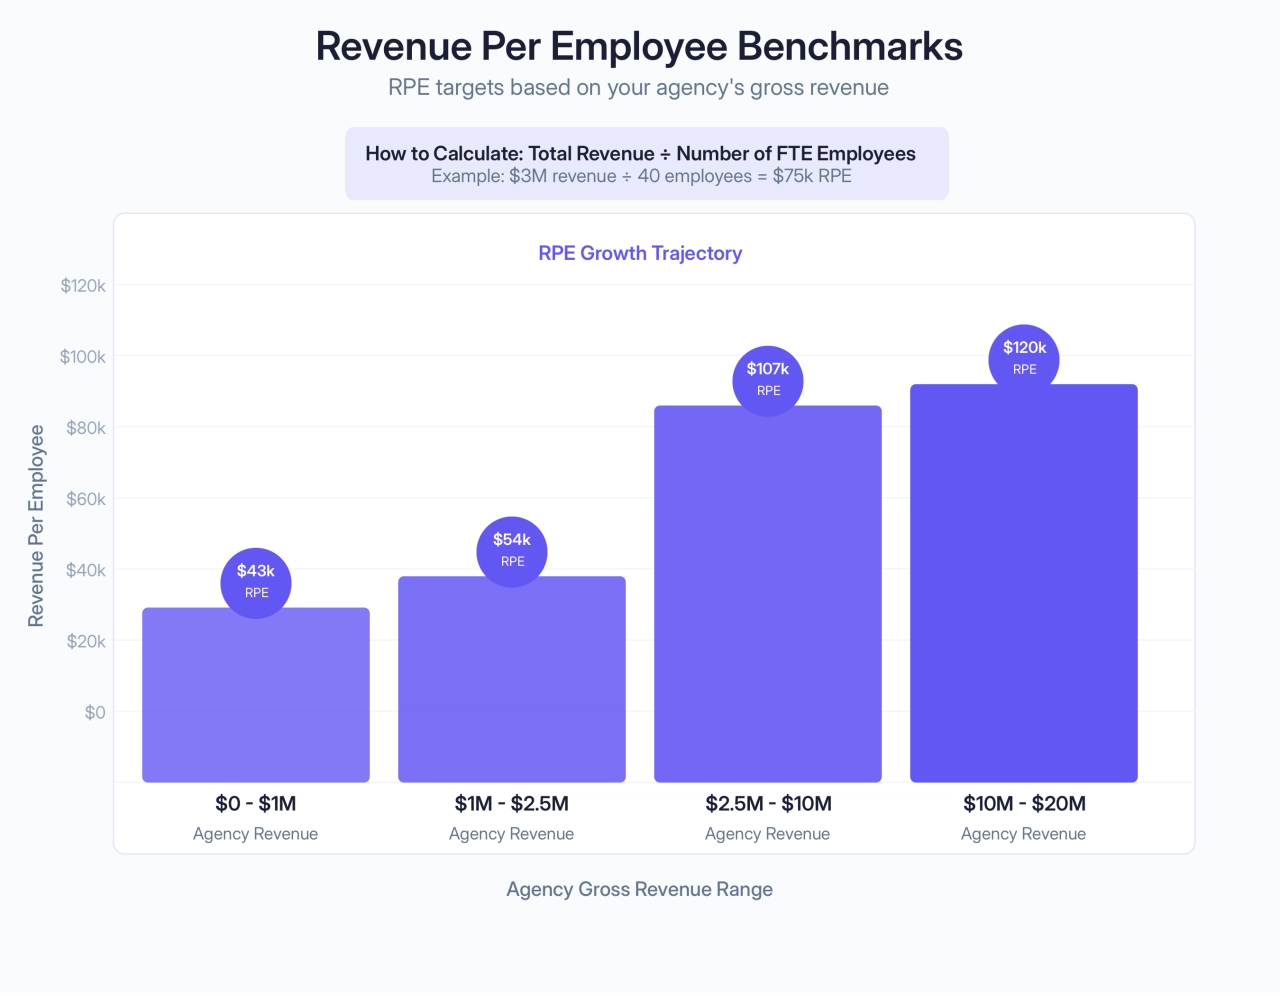
To calculate your RPE, take your agency’s gross revenue for a given period and divide it by the number of full-time equivalent (FTE) employees you had during that same period.
Example: If your agency has 40 FTE employees and generates $3 million in revenue in a given year, your RPE would be $3 million ÷ 40 employees = $75,000/employee.
Client relationship KPIs
These KPIs help you understand and improve your relationships with clients, which directly impacts long-term profitability.
Client retention rate
Your agency’s client retention rate (CRR) is a KPI that tells you what percentage of your clients stick with you from one year to the next.
To calculate your client retention rate, take the number of clients you have at the end of a given period and divide it by the number of clients you had at the beginning of that same period.
A high client retention rate is important for two reasons:
It’s much cheaper to keep a current client than it is to acquire a new one.
The more loyal your clients are, the more likely they are to give you referrals.
Example: Your agency started the year with 100 clients and ended the year with 90 left. CRR is (90 ÷ 100) × 100% = 90%.
Here are strategies to improve your client retention rate:
• Share success stories from existing clients to demonstrate capabilities and build credibility
• Establish regular feedback mechanisms to gauge client satisfaction and identify areas for improvement
Monthly recurring revenue (MRR)
Monthly recurring revenue is crucial for modern agencies, especially those that have switched to a subscription-based model or rely on retainers. Many agencies using the productized business model focus heavily on this metric.
The important thing about MRR is that it helps agencies see trends, plan for expansion with new hires, and adjust operations because they can forecast cash flow. Ideally, an agency isn’t only relying on monthly recurring revenue, but also yearly contracts.
Customer satisfaction & engagement
True success lies in creating long-lasting relationships built on mutual trust and satisfaction. Effective customer engagement is critical for fostering loyalty, driving retention, and fueling growth.
In measuring customer satisfaction, two key metrics are essential:
NPS measures the likelihood of a client becoming a reference or recommending your agency to others. A higher NPS indicates greater loyalty and advocacy among clients.
CSAT gauges overall satisfaction with specific services, providing insight into areas where improvements can be made.
By tracking both metrics, you’ll gain a comprehensive understanding of your customers’ experiences, allowing you to refine your offerings and strengthen relationships.
Quick reference: KPIs by department
While I’ve focused on agency-specific KPIs, here’s a quick reference showing how different departments typically approach KPI tracking:
Department | KPI Example | Agency Application |
|---|---|---|
Sales | Lead conversion rate | Track qualified leads to client conversions |
Marketing | Cost per acquisition | Monitor marketing spend efficiency |
Operations | Project completion rate | Measure delivery performance for clients |
Finance | Profit margins | Track profitability per client or service |
Customer Success | Net Promoter Score | Gauge client satisfaction and referral potential |
Creating KPI reports
Creating effective KPI reports is essential for marketing agencies who want to track performance and make informed decisions.
Data collection methods
Gathering accurate data is the foundation of any KPI report. Use different data collection methods to ensure your reports are reliable and actionable:
Automated tracking: Implement tools that automatically track and record KPI data, such as website analytics for traffic metrics or SPP.co’s analytics data for sales.
Manual input: For qualitative or less accessible data, manual input may be necessary. Ensure consistency and accuracy by establishing clear protocols for data entry.
Surveys and feedback: Collect data directly from customers or team members through surveys to gain insights into satisfaction and engagement levels.
Using reporting tools
Make use of reporting tools and software to automate the creation of KPI reports:
Dashboards: Use dashboard tools like Tableau or Looker Studio to visualize KPIs in real-time, providing an at-a-glance view of performance.
Spreadsheet software: Tools like Microsoft Excel or Google Sheets offer flexibility in data manipulation and presentation, ideal for custom reports.
Integrated platforms: Consider platforms that integrate with your existing systems, automatically pulling data into reports and reducing manual effort.
Preparing KPI reports
Follow this 7-step guide to set up your KPI reports:
Define objectives: Clearly outline the purpose of the report and the key questions it should answer.
Select relevant KPIs: Choose KPIs that align with your objectives and provide meaningful insights.
Collect and verify data: Gather data from your chosen sources and verify its accuracy.
Analyze and interpret: Analyze the data to identify trends, patterns, and areas for improvement.
Visualize data: Present data using charts, graphs, and tables to make it easily understandable.
Prepare the report: Structure the report with an executive summary, detailed findings, and actionable recommendations.
Present and discuss: Share the report with stakeholders, walking them through the findings and implications.
By following these steps, you can create impactful KPI reports that drive performance and growth.
Putting it all together
Success is an admirable goal for your agency—but it isn’t a very useful one. If you really want to build a more successful agency, you need to get specific about what you mean. You need to define what success looks like for your business and use data-driven KPIs to measure your goals.
The KPIs we’ve discussed in this guide are a comprehensive foundation for agency growth. By tracking these metrics, you’ll gain invaluable insights into what’s working well at your agency and what needs improvement.
Let's look at how to implement this practically:
Start with the fundamentals: Begin by tracking your CAC, LTV, and utilization rate. These three metrics will give you immediate insights into your acquisition efficiency and operational performance.
Build your tracking infrastructure: Set up the tools we discussed—Google Analytics, Stripe integration, and SPP.co’s analytics features. The initial setup takes time, but the ongoing insights are invaluable.
Create a reporting rhythm: Don’t just collect data—use it. Set up monthly KPI reviews where you analyze trends and make adjustments to your strategy.
The tricky part is that implementing KPIs requires both discipline and flexibility. You need the discipline to consistently track and review your metrics, but the flexibility to adjust your approach as you learn what works for your specific agency.
Frequently asked questions
How do you measure agency performance?
Track 5 essential KPIs: Customer Acquisition Cost (CAC), Client Lifetime Value (LTV), LTV/CAC ratio, utilization rate, and client retention rate. Start with CAC and LTV to understand acquisition efficiency. For example, spending $15,000 to acquire 4 clients means your CAC is $3,750. Use SPP's analytics dashboard integrated with Google Analytics and Stripe for automated tracking.
What are the 5 key performance indicators every agency should track?
Customer Acquisition Cost (CAC) - acquisition efficiency, 2) Client Lifetime Value (LTV) - revenue per relationship, 3) LTV/CAC ratio - should be above 3:1, 4) Utilization rate - aim for 60-85%, 5) Client retention rate - percentage staying year-over-year. These give a complete picture of profitability and growth potential.
How to write KPIs in 4 steps for marketing agencies?
Follow SMART framework: 1) Specific - “Increase MRR by $50,000 by year-end”, 2) Measurable - trackable with Google Analytics/SPP, 3) Attainable - relevant to your agency model, 4) Time-bound - clear deadlines like “5 clients at $10k/month by Q3 end”. Every KPI should connect directly to revenue or efficiency.
What is the best tool to track agency KPIs?
Combine SPP.co’s client portal with Google Analytics and Stripe. SPP.co integrates all three, automatically pulling data into your dashboard. Add Looker Studio for visualization. This setup tracks your complete customer journey from acquisition through retention.
What are good KPI examples for marketing agencies?
CAC: $15,000 spend ÷ 4 clients = $3,750. LTV: 5 projects × $5,000 = $25,000. Utilization: 350 billable hours ÷ 400 available = 87.5%. Revenue per employee: $3M ÷ 40 employees = $75,000. Client retention: 90 remaining ÷ 100 starting = 90%. Gross margin: ($90k - $30k) ÷ $90k = 67%.
How many KPIs should an agency team track?
Start with 5-7 core KPIs to avoid analysis paralysis. Begin with CAC, LTV, and LTV/CAC ratio. Add utilization rate and revenue per employee once tracking systems mature. Most successful agencies focus on 5-7 metrics that directly impact profitability, reviewing monthly rather than daily.
What makes a strong KPI for agencies?
Strong KPIs must be directly tied to revenue or efficiency, measurable with existing tools, and actionable by your team. “Client retention rate” is strong because it’s measurable and impacts LTV. Avoid vanity metrics unless they correlate with client acquisition. Every KPI should answer: “If this improves, does our agency become more profitable?”
Closing thoughts
Building a profitable, scalable agency requires more than gut instinct—it requires data-driven decision making guided by the right KPIs. The metrics in this guide aren’t just numbers to track; they’re the compass that will guide your agency toward sustainable growth.
Don’t try to implement all 10 KPIs at once. Start with the financial performance metrics (CAC, LTV, LTV/CAC ratio), then gradually add operational and client relationship KPIs as your tracking systems mature.
And I hope this post has been of help in transforming your agency from one that’s busy to one that’s genuinely profitable and scalable. Remember, what gets measured gets managed—and what gets managed gets improved.