- Agencies that automate their reporting save an average of 137 billable hours per month (AgencyAnalytics, 2022)—time your team can redirect to client work that actually generates revenue.
- Clients with 24/7 portal access to their performance data have higher retention rates and are more likely to increase budgets, since they can see campaign results without waiting for monthly reports.
- Nearly half (48%) of agencies identify tracking billable hours as their biggest operational challenge and manual reporting is one of the largest time drains contributing to this problem.
Manual client reporting creates a scaling problem. Add 10 new clients, and you add 10× the reporting work. Your team’s capacity stays the same.
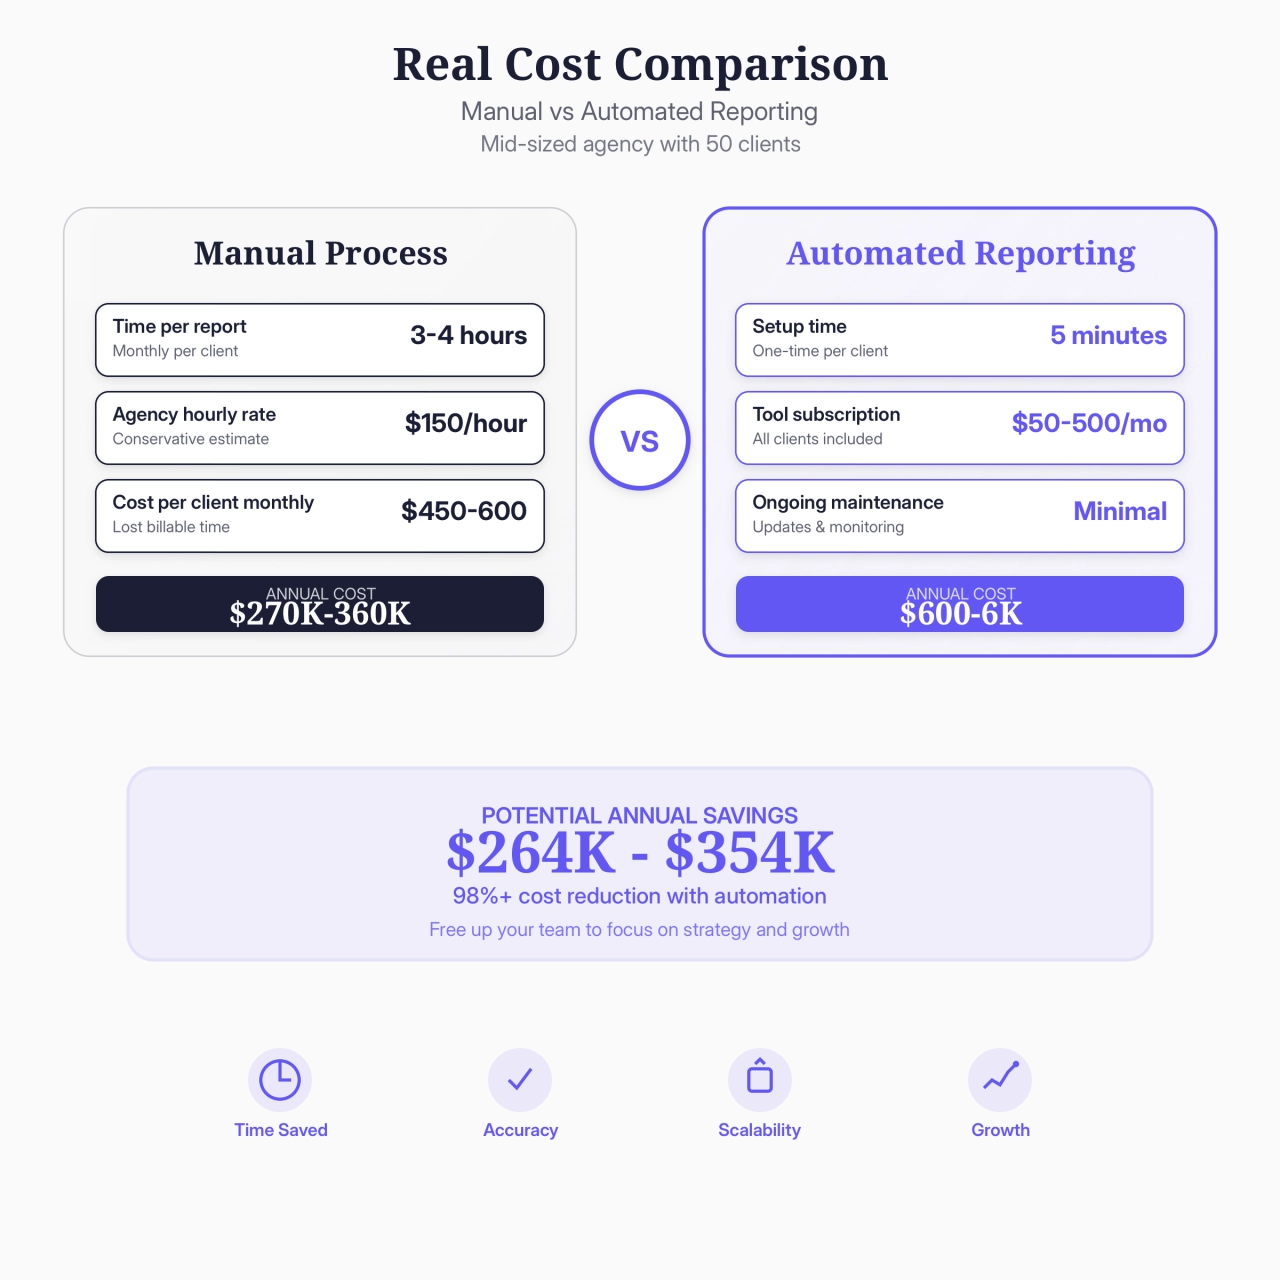
AgencyAnalytics’ 2022 Client Reporting Benchmarks study tracked 7,000 agencies and found they saved an average of 137 billable hours per month after automating their reports. At agency rates of $150-$224 per hour (Promethean Research, 2023), that’s $20,000-$30,000 monthly your team could spend on client work instead of compiling data.
Automated reporting gives you that capacity back. I’ll show you which tools work best for different agency sizes and how to roll them out to clients without causing confusion.
Understanding this topic involves several interconnected concepts:
Each of these concepts plays a crucial role in the overall topic.
Why manual reporting is draining your agency’s profitability
The scaling problem is straightforward: Manual reporting might work for 10 clients, but at 50 or 100 clients, the workload grows while your capacity doesn’t.
The cost adds up quickly. AgencyAnalytics’ 2022 study found agencies save an average of 137 billable hours per month after automating. At typical agency rates of $150-$224 per hour, that’s $20,000-$30,000 in monthly capacity freed up for actual client work instead of data compilation.
And it’s not just your agency feeling this pain. According to AgencyAnalytics’ 2024 Marketing Agency Benchmarks Report, nearly half (48%) of surveyed agencies identify tracking billable hours as their most significant operational pain point. When Promethean Research found that 65% of digital agencies charge between $150 and $224 per hour, you realize how much revenue you’re leaving on the table with manual reporting.
With agencies, the most important thing is billable hours. So you lose a lot of billable hours. And within Europe and US, I think the average is about 80 to 100 euros or dollars an hour for a senior, which could be billing to the customer, but you can’t bill a thousand for a report, right?
 Justas Malinauskas,
Whatagraph
Justas Malinauskas,
Whatagraph
Here are three reasons why agencies should automate their reporting:
Free up billable hours: Automation eliminates the time your team spends pulling data from multiple platforms and formatting reports. That time goes back to client work that generates revenue.
Scale without adding overhead: Automated reports take the same amount of time whether you have 10 clients or 100. You can grow without your reporting workload growing with it.
Standardize your process: Everyone uses the same templates and pulls the same metrics. This makes it easy to hand off clients between team members and train new hires.
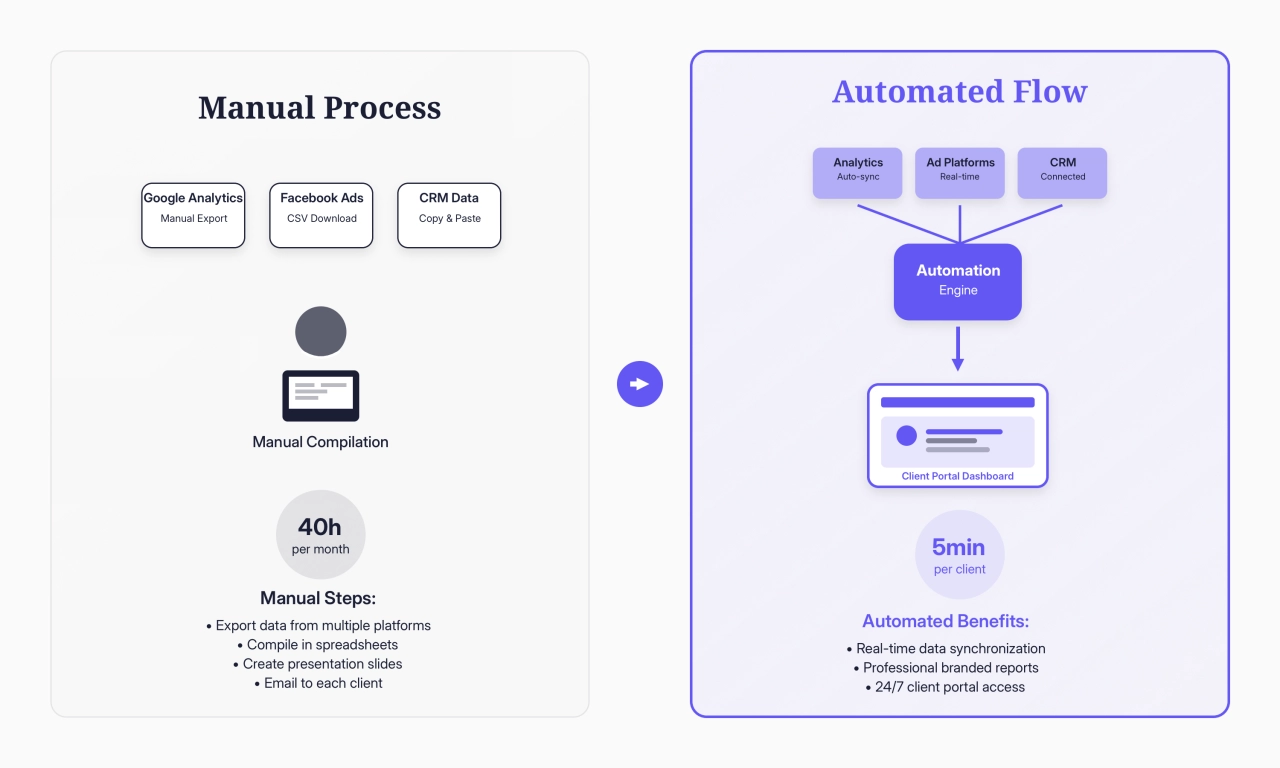
Automated reporting changes this. The right tools sync client data in real-time and deliver reports directly to client portals. We’re talking about reducing 40 hours of manual work per month down to 5 minutes of one-time setup per client, after which reports run automatically.
Automating your client reporting in 3 steps
I’m sure I don’t have to convince you that client reporting should be automated at this point, the question is: how do I do it?
Let me guide you through the process step-by-step.
1. Selecting KPIs that actually matter to clients
What is it that you want to display in your reports? To answer that question, we need to know what kind of client report we’re building, for example:
email marketing report
social media management report
Depending on the report type, the metrics you’ll display, and therefore the data sources, will be different. Pick KPIs that tie directly to what your client cares about.
When reporting, you must always ensure you consider both who the report touches first and last. If a CMO or COO reviews your deck, and it's just gibberish about DR scores, you are going to be the first vendor cut when budgets get tight. Always tie back to bottom line business impact.
 Jeremy Moser,
uSERP
Jeremy Moser,
uSERP
Generally speaking, all of them should have the following characteristics:
Understandable: Charts and graphs are nice, but what do they mean? The main idea of client reporting is not to display data, but to draw conclusions from them. Create a summary section showing improvements/losses compared to the previous reporting period.
Accessible: If you’re one of those agencies that sends reports on certain dates, you should reconsider if that is the best approach. Not everyone has the time to look at them right then. Modern reporting platforms provide access to a dashboard where they could look at their reports whenever they want.
Accurate: This one should go without saying. Be sure to sanity-check the data you’re getting before you pass them along to the client. Data discrepancies can lose you the client’s trust. And we don’t want that.
Customized: Not every client should get the same report. Some need more details than others. Dashboards can be customized to show only what clients care about, removing clutter and leaving them with just the actionable data.
2. Choosing the right reporting tool
The right reporting tool depends on your agency size, data sources, and budget. Here’s how to decide:
Your agency size:
Under 10 clients: Free tools like Looker Studio work fine
10-50 clients: Dedicated agency tools make sense
50+ clients: Advanced platforms with benchmarking
Your data sources:
Google-only: Looker Studio is easiest
Multi-platform: Need native integrations (Whatagraph, DashThis)
Complex needs: AgencyAnalytics for advanced analytics
Your budget:
$0-50/month: Looker Studio (free) + connectors
$150-300/month: DashThis or Whatagraph
$300+/month: AgencyAnalytics for enterprise features
If you’re tracking SEO performance for clients, you’ll also want to consider how you’ll monitor and report on backlinks, since manual backlink checking is another time drain that can be automated.
Answer a few questions to discover which reporting tool best matches your agency's specific needs and budget
Now let’s look at each option in detail.
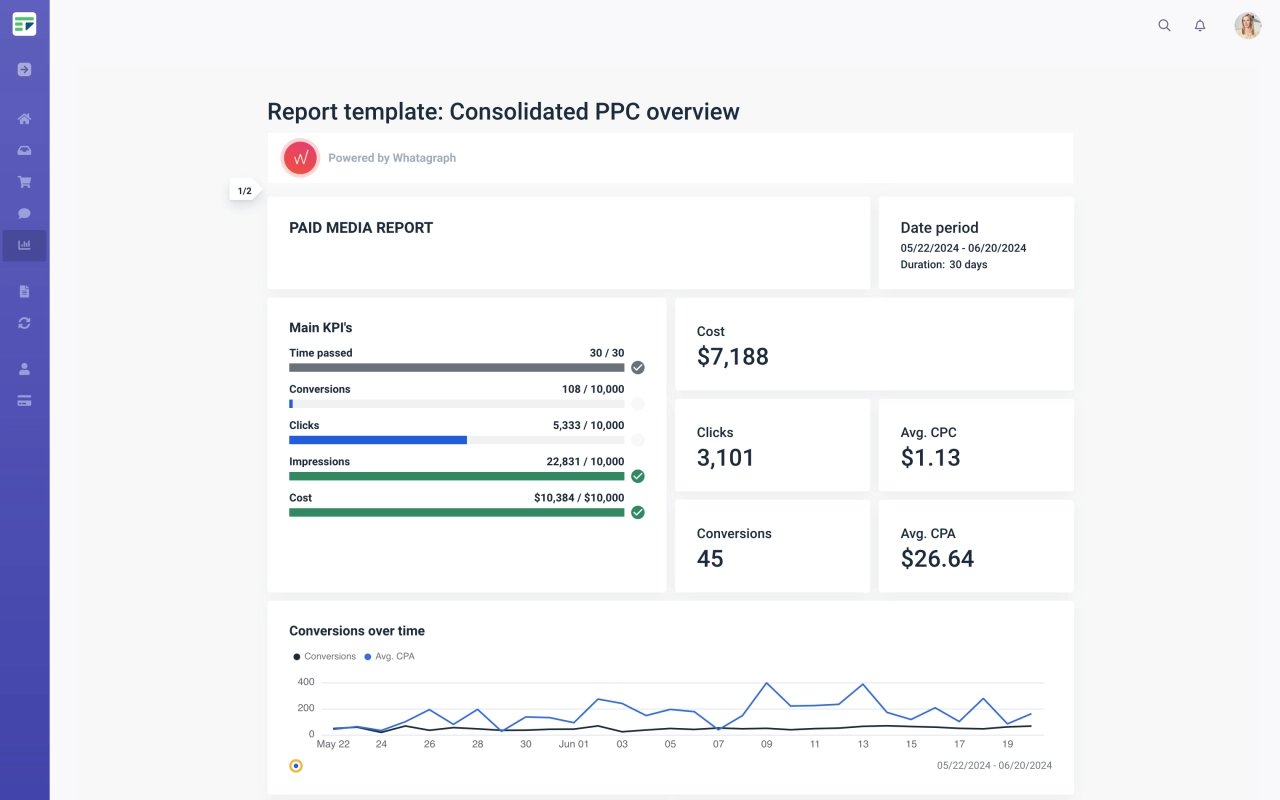
Whatagraph
Whatagraph is the most popular reporting tool for mid-sized agencies. The drag-and-drop interface lets you build professional reports without technical expertise, and 40+ native integrations cover all major marketing platforms—Google Analytics, Facebook Ads, email tools, and CRMs.
Reports pull fresh data in real-time and update automatically. You can white-label them with your agency branding, schedule automatic delivery, and give clients access through secure portals. The platform balances ease of use with customization options, letting you create reusable templates while still tailoring individual reports to specific client needs.
I think in early days, the biggest problem was that […] you really need to spend man-hours on preparing reports… But usually it took about, I think rule of thumb was about three to four hours per one report.
Justas Malinauskas,
Whatagraph
Best for: Agencies managing 10-50 clients who need professional automation without a steep learning curve or enterprise-level costs.
AgencyAnalytics
AgencyAnalytics combines reporting automation with client management features that most standalone reporting tools don’t offer. Built specifically for agencies, the platform goes beyond basic dashboards to include tools for managing your entire client relationship.
You get SEO rank tracking, PPC monitoring, and social media analytics in one place, with over 70 marketing integrations. The platform includes automated email reports and a client portal where clients can log in 24/7 to view their data. Advanced features include call tracking integration, staff management tools, and the ability to compare client performance against industry benchmarks—useful for showing clients how they stack up against competitors.
AgencyAnalytics provides easy to understand, transparent SEO reports for our clients at scale. It is great for internal tracking and coordination too.
 Harry Strick,
Ranked.ai
Harry Strick,
Ranked.ai
Best for: Data-driven agencies who need advanced analytics capabilities and want to provide clients with industry benchmarking and predictive insights.
Dashthis
DashThis prioritizes simplicity and speed over advanced features. The platform comes with preset templates for SEO, PPC, social media, and email marketing that you can implement with just a few clicks, making it one of the fastest tools to get running.
Key capabilities include automated report scheduling, white-label customization, real-time data updates, and the ability to create multiple dashboards simultaneously. With over 40 integrations, it consolidates marketing data from all major platforms into a single view. The tradeoff for this simplicity is fewer advanced analytics features compared to AgencyAnalytics or customization options compared to Looker Studio, but for agencies serving clients with standard marketing needs, the speed of implementation makes up for it.
With Dashthis, you can create automated reports in three easy steps: Connect your marketing platforms, integrations, and data sources (Social media, Google Analytics, Google Ads, etc.); choose between report templates to track KPIs for SEO reporting, marketing campaigns, PPC, or social media, or start a report from scratch; the tool will gather all your most important KPIs into an automated dashboard so you can see your metrics in real-time.
 Elisabeth Dignard,
DashThis
Elisabeth Dignard,
DashThis
Best for: Agencies who prioritize ease of use and quick setup over advanced customization, particularly those serving clients with standard marketing needs across common platforms.
Looker Studio
Looker Studio (formerly Google Data Studio) is free for Google data sources and offers unlimited customization. The platform excels at creating highly customized reports and dashboards with Google Analytics, Google Ads, Search Console, and Google Sheets data.
Advanced features include calculated fields, custom dimensions, and the ability to blend data from multiple sources into unified reports. The tradeoff is more manual setup than dedicated agency tools and a steeper learning curve—you’ll need some technical knowledge to build complex reports. Third-party connectors for non-Google platforms can also get expensive ($50-300/month per connector), but if you’re working primarily within Google’s ecosystem, the zero per-client costs make it hard to beat for smaller agencies.
Best for: Budget-conscious agencies heavily invested in Google’s ecosystem, or agencies with technical resources who want maximum customization control over their reporting.
Comparing the top agency reporting tools
Here’s what you need to know about each tool before you commit:
Tool | Best For | Starting Price | Key Strength | Watch Out For |
|---|---|---|---|---|
Looker Studio | Small agencies (<10 clients), Google-heavy tech stack | Free (Google sources) | No per-client costs, unlimited customization | Steep learning curve, expensive third-party connectors ($50-300/month) |
Whatagraph | Agencies scaling from 10-50 clients | $286/month | Quick setup with pre-built templates, 40+ native integrations | Limited customization compared to Looker |
DashThis | Agencies prioritizing speed over customization | $159/month | Easiest to implement, automated scheduling built in | Basic features, fewer advanced analytics options |
AgencyAnalytics | Large agencies (50+ clients) needing advanced analytics | $239/month | Predictive insights, industry benchmarking, white-label | Higher cost at scale, overkill for smaller agencies |
The biggest mistake agencies make is picking a tool based on features instead of their actual workflow. If you’re spending more time configuring the tool than it saves you in reporting hours, you picked wrong.
3. Integrating reports into your client experience
Once you’ve selected your tool and configured your reports, the final step is rolling them out to clients in a way that enhances their experience and improves client communication.
Start with your most engaged clients first: Don’t automate everyone at once. Pick 3-5 clients who are patient, communicative, and understand you’re implementing improvements. These pilot clients will help you identify issues before you roll out to your entire client base.
Introduce the change proactively: Don’t surprise clients with a new system. Send a brief email explaining: “We’re upgrading your reporting experience to give you 24/7 access to your data through a secure portal. You’ll still receive your regular reports, but now you can also check performance anytime.”
Provide multiple access options: Some reporting solutions allow you to send reports via email, and while that isn’t a bad option, I think it’s outdated. Let me put it this way: what does your inbox look like right now? Is it full of unread emails? I bet your client’s inbox is the same.
Instead of risking your reports getting buried in their inbox, give them access to a client portal where they can log in at any time and visualize their data. The biggest benefit is that they’re in control—they can check performance when they need to, not when your report happens to arrive.
Create a simple walkthrough: Record a 2-minute video showing clients how to log into their portal and where to find key metrics. Most clients won’t watch the whole thing, but having it available reduces support requests and shows you care about their experience.
Run parallel reporting for the first cycle: During your first month of automation, send both the automated report and keep doing whatever you were doing before. This lets clients compare the formats and builds trust that the new system is accurate.
Set expectations about real-time data: One benefit of automated reporting is that clients can see data updating daily or weekly instead of waiting for month-end reports. But make it clear: “Your dashboard updates daily, but we recommend focusing on weekly or monthly trends rather than day-to-day fluctuations.”
Reporting Integrations

Expect this rollout phase to take about two weeks for your pilot group. Most clients adapt quickly once they see how much easier it is to access their data on demand.
What to expect when you start automating reports
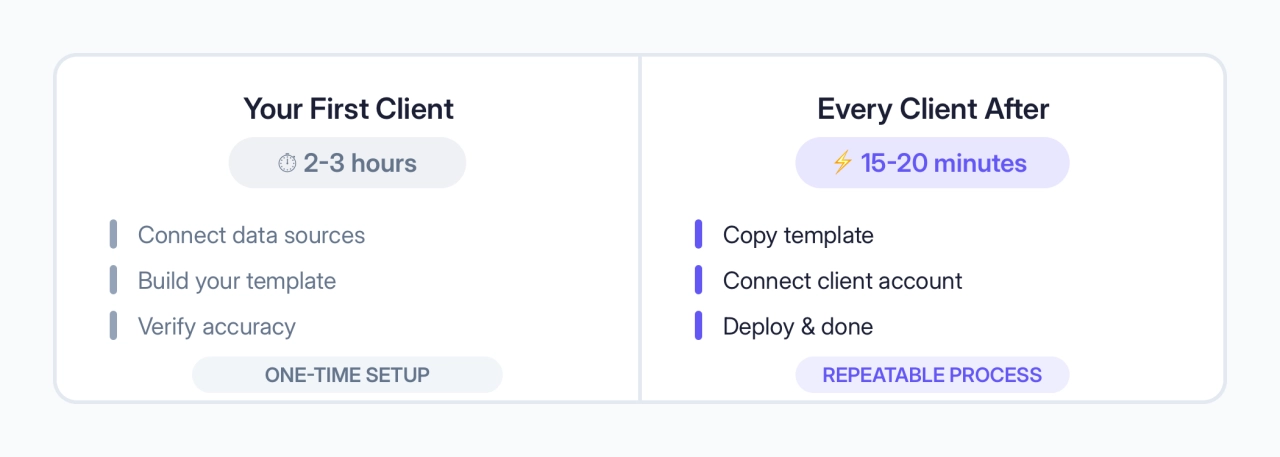
Most reporting tools advertise setup in minutes. They’re talking about connecting accounts, not building actual reports. Expect to spend 2-3 hours on your first client: connecting data sources, building your template, and verifying the numbers match your manual reports. After that, each new client takes 15-20 minutes. The interfaces are straightforward—your team will figure out where things are without much training.
Fix your tracking before you automate anything. Messy Google Analytics goals or inconsistent UTM parameters will show up immediately in automated reports. You’ll spend more time explaining discrepancies than you saved.
Run both systems for one full reporting cycle. Your team won’t trust the automated numbers until they see them match what they pulled manually. Once everyone’s comfortable with the accuracy, drop the manual process.
Agencies typically spend their first week rebuilding their old manual reports in the new tool. Skip this step. Start with 3-4 core KPIs that clients actually ask about, then expand based on feedback. Most of those extra metrics in your old reports weren’t getting looked at anyway.
You’ll see the time savings after your first full month. The setup time pays back in the first billing cycle. If implementation is dragging on, you picked the wrong tool for your workflow or you’re making it more complicated than it needs to be.
How to avoid the most common reporting automation mistakes
Here’s what I see most agencies mess up when they first automate their reporting: they pick a tool, connect a few data sources, and think they’re done. Then three months later, they’re dealing with angry clients because the numbers don’t match what’s in Google Analytics.
The tricky part is that automation amplifies whatever problems you already have. If your Google Ads account isn’t properly tagged, your automated reports will show garbage data—just faster. Case in point: I’ve seen agencies lose clients because their automated dashboard showed $0 in conversions while the client could see actual sales in their Shopify account.
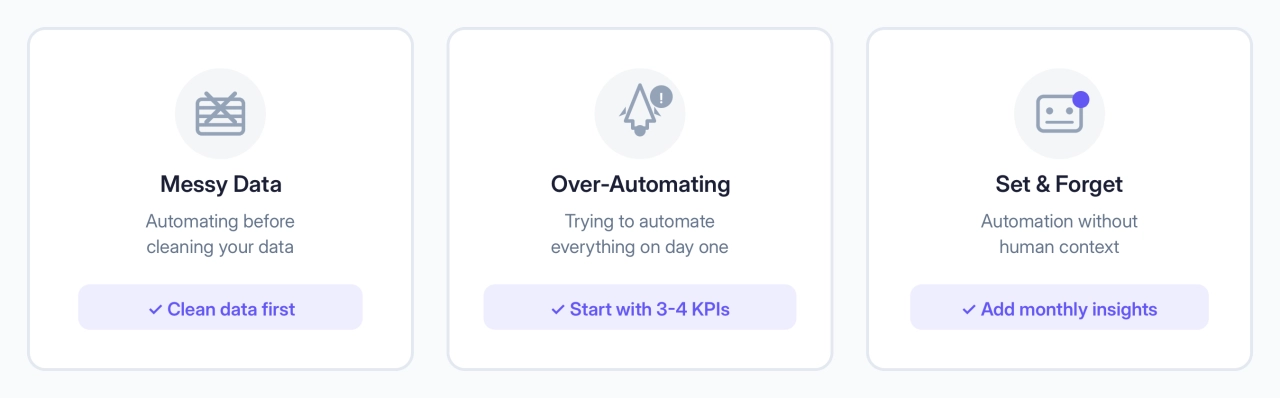
Here are the three mistakes that’ll kill your automation project before it starts:
Not cleaning your data first: You can’t automate messy data and expect clean reports. Before you connect anything, audit your Google Analytics goals, check your UTM parameters, and make sure your conversion tracking actually works.
Over-automating from day one: Don’t try to automate every metric and data source immediately. Start with 3–4 core KPIs that matter most to your clients—usually traffic, leads, and conversions. You can always add more complexity later, but you can’t easily remove it once clients expect to see 47 different metrics.
Forgetting the human element: Automation doesn’t mean “set it and forget it.” Your clients still need context about what the numbers mean. Include a monthly summary email explaining trends, highlighting wins, and addressing any concerning drops. The best automated reports still feel personal.
Tracking the ROI of your reporting automation
Let’s talk numbers, because your CFO is going to ask how much this automation actually saved you. And honestly, most agencies can’t answer that question because they never tracked their baseline.
Here’s what you should measure before and after automation:
Time savings: Track exactly how many hours your team spent on reporting last month. Use a billable hours tracking tool to establish your baseline before automating. For most agencies, it’s shocking—often 20-25% of their total billable capacity. After automation, you should see this drop to under 5% within 90 days.
Client retention: This one surprised me. Agencies with automated reporting see much higher client retention rates. Why? Because clients can access their data anytime, they feel more in control and trust you more.
Upselling opportunities: When clients can see their results clearly, they’re more likely to increase their budget. Again, this goes back to trust. When they see your work pays off, they’re more likely to spend money.
Measuring soft benefits like team morale and client satisfaction is harder to quantify. But here’s a simple test: ask your team if they’d rather spend Friday afternoon creating reports or working on strategy. I’m sure they will be very willing to track their time systematically.
Frequently asked questions
Which automated reporting tool is best for my agency size and niche?
If you’re under 10 clients and mostly use Google tools, Looker Studio is free and gets the job done. Whatagraph and DashThis work better for 10-50 clients since they’re easier to set up, and AgencyAnalytics makes sense once you’re past 50 clients or need deeper analytics.
How do I migrate from manual reports to an automated system without disrupting client relationships?
Keep sending your regular reports while you test the new system for one month to catch any issues. Then tell clients you’re upgrading them to real-time access instead of monthly PDFs.
What are the best practices for customizing report templates for different clients?
Make 2-3 templates instead of custom reports for everyone. Your executives want revenue and ROI numbers, marketing managers want CTR and engagement, and you should skip the metrics that don’t help them make decisions.
How can I ensure data accuracy and consistency across all integrated platforms?
Check your tracking setup first. Make sure Google Analytics goals match your Google Ads conversions, UTM parameters are the same everywhere, and Facebook attribution will always show different numbers than Google Analytics, so tell your clients why upfront.
What if my client prefers email reports over accessing a portal?
You can send automated PDF reports by email and give them portal access too. Most clients who say they only want emails end up using the portal within a few months anyway.
How often should I review and update the KPIs in my automated reports?
Check them every quarter or when your strategy changes. Traffic and impressions matter early on, but six months later you should be focused on conversions.
Can these reporting tools integrate with my specific CRM like HubSpot or Salesforce?
AgencyAnalytics and Whatagraph connect directly to HubSpot, Salesforce, and Pipedrive, but you’ll need Zapier or Make ($20-50/month) for less common CRMs. Check if your specific CRM is listed on their integrations page because “CRM integration” doesn’t mean they support yours.
What about GDPR and data privacy for client reporting?
Most major reporting platforms are already GDPR-compliant and offer Data Processing Agreements (DPAs) on request. Make sure your agency contracts include a clause about how client data flows through your reporting tools. If you’re working with EU clients, verify your tool stores data on EU servers or get explicit consent for data transfers.
Your next steps to automated reporting success
Start by tracking how many hours your team spent on reporting last month. That’s your baseline for measuring ROI after you automate.
Next, pick your tool based on your agency size. Under 10 clients, start with Looker Studio. Between 10-50 clients, Whatagraph or DashThis will save you time without overwhelming your team. Past 50 clients, AgencyAnalytics gives you the analytics depth you need to scale.
Test with 3-5 pilot clients before rolling out to everyone. Pick clients who understand you’re upgrading their reporting experience and won’t panic if something looks different. Run parallel reporting for one month to build confidence, then transition fully.
If you’re not already using a CRM to manage client relationships, now’s a good time to add one. Check out our guide on the best CRMs for agencies to see which ones integrate with your reporting tools.